Since President Nelson assumed office, I’ve read a number of discussions of how he seems to get quoted a lot in General Conference, even in comparison with previous Church Presidents. For example, it’s mentions of his name rather than quotes, but TheFingerLakesBandit posted a graph (presumably based on Corpus of LDS General Conference Talks data) on the Mormon Subreddit a few months ago that showed that President Nelson’s name has a much bigger spike than any other newly-called Church President since World War II or so. And this certainly matches my own experience: I feel like he’s quoted a ton.
When I was working on my Conference review post last month, I decided to note all the sources quoted so I could do a little comparison. I chose to compare this last Conference against April 2011. I chose it as a comparison point not because it was a decade ago, but because at that point, Thomas S. Monson had been Church President for about as long as Russell M. Nelson has been now (it was the seventh Conference as President for each of them).
For each quote in each talk, I noted the following:
- The speaker’s name and position
- The source of the quote
- The length of the quote in words
Of course there are many different sources quoted in Conference. The majority are from scriptures, but there are also lots of other Mormon and even occasionally non-Mormon sources. To make the data easier to look at, I sorted the quotes into the following categories by type of source:
- Deity (scriptures that are in the words of Jesus)
- Ancient prophet (most non-deity scriptures)
- Latter-day prophet (including some D&C verses in Joseph Smith’s voice instead of Jesus’s)
- Latter-day GA
- Current prophet
- Current GA
- Other Mormon
- Other non-Mormon (including occasional bits of scripture like Pharisees interrogating Jesus)
I excluded three types of quotes entirely:
- Sometimes a speaker quotes a source and then uses a phrase from that source repeatedly throughout their talk. For example, in her 2011 talk, Mary N. Cook quoted the song “Kindness Begins with Me.” Then, throughout the talk, she repeated the phrase “remember this: kindness begins with me” several more times (and once just “kindness begins with me”). I counted the first quote, but excluded the others.
- Sometimes a speaker quotes someone in the context of telling a story rather than because they’ve said a wise thing. When a quote was just used for the story, I excluded it, because I wanted to count only cases where someone is quoted for their wisdom. For example, in this 2011 talk, Quentin L. Cook told the story you might remember about a teen girl’s purse that was left at a dance, and how the people who found it inferred what kind of person she was based on its contents. In telling the story, he quoted from the stake YW President talking about the contents of the purse. I didn’t include this quote.
- Following the same principle as the previous point, if a speaker quoted something they thought listeners might be saying or thinking, I didn’t count that. For example, also in a 2011 talk, Dieter F. Uchtdorf supposed that people might be texting each other about his talk and saying “He’s been speaking for 10 minutes and still no aviation analogy!” As this wasn’t included in the talk because it shares a bit of wisdom, I excluded it.
The biggest difference between the two Conferences is that April 2011 had an extra session (General Young Women) because it was before women’s meetings were moved to Conference weekend and alternated with General Priesthood meeting. The number of talks was similar, though (37 in 2011, 35 in 2021), because the 2021 talks were generally shorter (an average of 1560 words versus 1820 in 2011). A similar fraction of the total words in talks were quotes, 15% in 2011 and 16% in 2021. Because of this, I did all the analyses below by looking at quotes of a particular source as a fraction of total quotes, rather than as a a fraction of total words. Also, to take into account different length of quotes, I used words in quotes as the unit of analysis (for example, counting a 20-word quote for twice as much as a 10-word quote) rather than individual quotes.
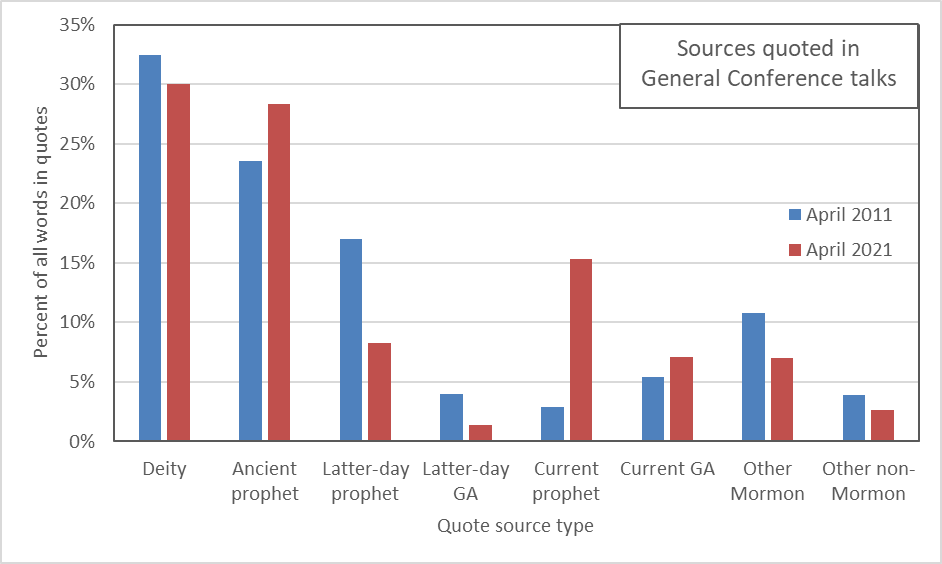
This first graph shows the percentage of quoted words coming from each of the eight source types, comparing April 2011 against April 2021. For example, the leftmost blue bar says that about 33% of words in quotes in April 2011 Conference were quotes of deity.



 Taylor in a meeting that Joseph Smith had always opposed the ordination of black men. Joseph F. Smith disagreed with them in 1879, but by 1908, he had come around to their point of view and reported that Joseph Smith had later declared Abel’s ordination “null and void.” Brooks hypothesizes that Joseph F. Smith’s change of heart might have been related to the recent death of Jane Manning James. She suggests that the presence of prominent black Mormons like James might have actually served as a brake for a while on such editing of recollections. In any case, I was fascinated to read this bit of connecting of dots as to how the Church went from ordaining black men at the beginning to deciding that no, in fact, black people were to be barred from both priesthood and the temple.