What are the most liked General Conference talks? I wrote a post a few years ago where I looked at Facebook likes of talks to see which talks got the most likes. Unfortunately, when I went back recently to update this post, I found that the Facebook like button has been removed from the General Conference talk pages on lds.org. Using the Wayback Machine, I looked at site snapshots going back a few years, and it looks like this feature was removed in March, 2016. I was lamenting this fact on Facebook when my co-blogger Katya pointed out that Conference talks are still available on YouTube, and there are like and dislike buttons.
I wrote a little script to get the counts of views, likes, and dislikes for all the talks posted at the LDS General Conference YouTube channel. This includes talks from April 1971 through April 2019 Conferences. The channel also has videos for other things like musical numbers and statistical reports, but for this post, I’m just looking at the talks.
There are a total of 3,508 talks across the 97 Conferences, given by 473 unique speakers. Just as an aside, the data needed a bit of cleaning for me to make speakers’ names consistent, as there are typos in some of their names (for example, A. Theodore Tuttle is identified once as “A. Theodore Turtle”), as well as straight up inconsistent naming (for example, M. Russell Ballard is identified at least once using the suffix “Jr.,” but most of the time it isn’t included).
Here’s a list of the top 20 speakers who have given the most talks.
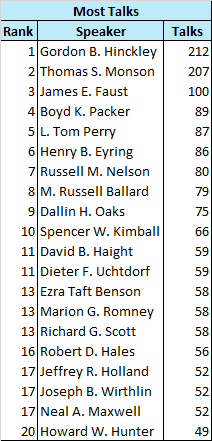
Wow! Gordon B. Hinckley and Thomas S. Monson have each given over 6% of all the talks in the sample, and each more than twice as many as any other speaker. I guess this is no surprise given how long both served not only as Church President, but also in the First Presidency. President Nelson would have to live–and be healthy enough to deliver Conference talks–for over a decade to get close to them. It’s probably Elder Bednar, who doesn’t even make this list (he’s at #23 with 29 talks) who has the best chance of joining them, as he’s likely to serve as Church President for a long time.
When I set out to gather these data, I was hoping to look at counts of views, likes, and dislikes separately. Unfortunately, I found that the three variables are highly correlated. The correlation between views for a talk and likes for the talk is 0.98, and for the other two pairs (views with dislikes and likes with dislikes), it’s nearly 0.90. Correlations range from -1 to 1, and values close to 1 mean that the variables being correlated contain almost completely redundant information (given approximately linear relationships between the variables, which we have here). So for example, if I were to make a list of the most viewed talks, it would be almost exactly the same as the list of the most liked talks. In order to avoid just showing a bunch of redundant tables, in this post I’ll just be looking at views, as it’s the most granular of the three variables.
The 3,508 talks have a total of 11,171,106 views. Or at least they did a couple of weeks ago when I gathered the data. I’m sure some of the most recent talks in particular have more views now. Which speaker’s talks have been viewed the most? Here are the top 20.
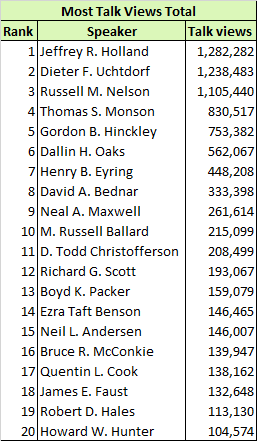 In my post a few years ago, it was also Elders Holland and Uchtdorf who had the most likes of their talks (although in that post, I looked at just the previous few Conferences). It’s interesting to see some consistency in the data even when they come from different platforms.
Of course, this list favors speakers who have given a lot of talks and therefore have more chances to pile up views. To adjust for differences in number of talks given, I divided total views by total number of talks given. Here are the top 20 in views per talk. I set a minimum of three talks for a speaker to be included.
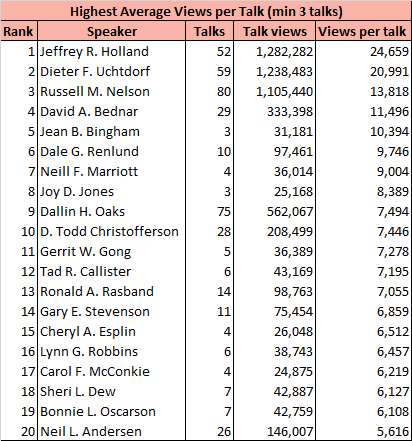 The top three–Holland, Uchtdorf, and Nelson–are the same as in the total views list. After that, it’s notable that there are some women breaking onto the list, starting with Jean B. Bingham at #5. In total, seven of the top 20 are women, which is kind of shocking to me, in a good way. We’re a church that listens to men over and over and over, always and forever. It’s kind of great to see that even with their severely limited Conference participation, the women leaders are giving some talks that are attracting some views.
There’s another way that these data should really be normalized, though, and you’ve probably already thought of it. More recent Conferences probably have far more views than older Conferences. YouTube didn’t even exist yet when most of them were held, and perhaps even more importantly, Church curriculum wasn’t so heavily focused on Conference talks until just the last few years. Here’s a graph showing total views of talks by Conference across the years.
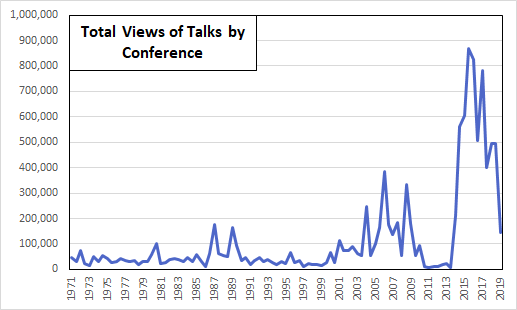 There’s the expected increase in recent years, although it has been far from smooth. I have no idea, for example, what happened in 2011-2013. My guess is that this indicates that the videos of these talks were somehow handled differently when the Church posted them on YouTube. Like perhaps they were uploaded once and then deleted accidentally and then uploaded again later, or some other such thing that caused their view counters to be reset to zero. In any case, it’s clear that just counting total views, or even views per talk, is missing these dramatic differences in how much each Conference as a whole is viewed.
Here’s the adjustment that I did to account for differences over time in how much a Conference’s talks are viewed. First, I converted total views for each talk into percentage of all views for that Conference. Then, I calculated the expected percentage of views if all talks in the that Conference had gotten an equal number (which is just one over the number of talks in that Conference). Finally, I subtracted the second value from the first to get the extra views (or shortfall in views) for each talk, compared to an equal distribution of views for that Conference.
Here’s a made-up example to clarify the calculation process. Say there’s a Conference speaker named Elder Jane Q. Virtuous. She gives a talk in the April 2050 Conference, and that talk has 3,000 YouTube views. The total number of YouTube views for all talks in the April 2050 Conference is 50,000. Elder Virtuous’s talk therefore accounts for 6% of all views for that Conference: 3,000 / 50,000 = 0.06 = 6%. Say there are 40 total talks in the April 2050 Conference. If all talks had an equal number of views, her talk would have gotten 2.5% of the views: 1/40 = 0.025 = 2.5%. Finally, we need to calculate the difference. To avoid being misleading by suggesting that the differences are percentage differences, I’ll talk about both percentages as percentage points. Elder Virtuous’s talk thus gets an extra 3.5 percentage points of views when compared with the expected number if all talks in the Conference had gotten an equal percentage of the views: 6 – 2.5 = 3.5.
I repeated this calculation for every talk for every speaker. When a talk gets more than its expected share of views for a Conference, the result is a positive number. When a talk gets fewer than its expected share of views, the result is a negative number. For each speaker, I added up these differences for all of their talks. Here is a list of the top 20 speakers in terms of their total percentage point differences.
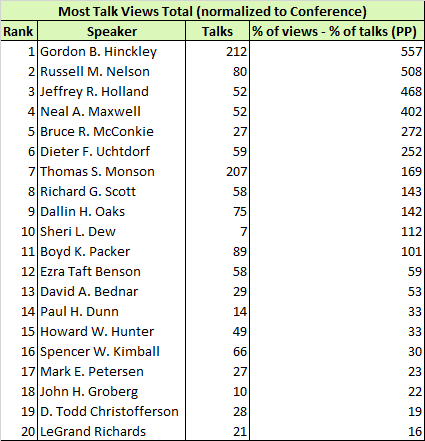 Gordon B. Hinckley jumps from #5 in the list of total views to the top spot. Elders Holland and Uchtdorf are still near the top of the list, but they fall back a little when the advantage they get from giving talks in more recent Conferences with generally higher numbers of views is adjusted away. On the other side, speakers who mostly gave talks in Conferences further in the past see their position improved. Bruce R. McConkie, whose last talk was in 1985, jumps from #16 to #5. Sheri L. Dew, Paul H. Dunn, Mark E. Petersen, John H. Groberg, and LeGrand Richards, who weren’t even in the top 20 before, move into the list.
But of course, this list has the same issue as the list of total views does: it doesn’t account for how many talks a speaker has given to pile up all their percentage point differences. The issue is lessened by the fact that the percentage point differences can be both positive and negative, so adding an extra talk won’t necessarily move a speaker up on the list. Still, though, I thought it would be interesting to combine the two adjustments–normalizing to Conference and normalizing to number of talks–to see which speakers had gotten the most extra views per talk. Here are the results.
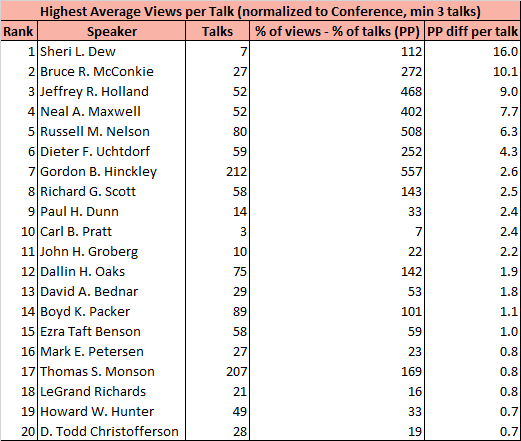 Wow! Sheri L. Dew jumps all the way from #18 in the list of views per talk to the top spot. And she’s way up in the top spot too. She has more than 50% more extra percentage points of views per talk than the #2 person. She’s further from #2 than #2 is from #6. Similarly, Bruce R. McConkie jumps all the way from not being on the views per talk list to #2 on this list. Many of the other speakers on this list also appear on earlier lists, but with some shuffling.
One point I wanted to mention is that I think it would be more entertaining if these counts of views arose solely from individual members’ interest in particular talks. Given, though, that Conference talks are now used so much in our curriculum, I suspect they more likely reflect interest by whatever decision-makers are choosing which talks to use as the basis for lessons or talks, and then the individual members are just dutifully looking up the talks that the decision-makers chose. I’m guessing that it’s generally more recent Conference talks that are being used this way, though, so as you go further back in time, it seems more likely that the counts of views might be more reflective of actual interest by individual Church members.
In this post, I’ve just looked at speaker-level data. In my next post, I’ll look at talk-level data. For example, I’ll reveal which of Elder Holland’s and Sister Dew’s and Elder McConkie’s talks are the most viewed. I’ll also tell you which Conference talk is a dramatic outlier in terms of how many dislikes it has received.
.
Nice work. Excited to see the next part!
D’you know, I like the explanations of “to guard against this, I did that” almost as much as the answers you find. It highlights the the depth of thought that goes into even asking the right questions. As always, thanks, Ziff — and as always, I’m looking forward to the next part.
Thanks, Th!
And thanks, Ardis! I love that you find my explanations of what I’m trying to do with the adjustments interesting!
Excellent stats. I know we don’t have churchwide directives to study particular talks, but I’d wager that most of the YouTube views are related to lessons (either teacher prep or actually showing the talks in a lesson). I’m guessing you’re not able to access granular statistics on view dates, but I’d be interested to see if particular talks are only viewed on Sundays.
Great post as always Ziff. Follow up question: in 2050, is Brother Martin Charity the General Primary President?
Bro. Jones, I’m sure you’re right! It would be fun to have day-of-the-week data for the views.
MTodd, I certainly hope so!