When I blogged last month looking at temple activity in Utah, and how patrons move between temples when their first choice is closed, several commenters asked about utilization: What fraction of endowment session seats are being filled? In this post, I’ll show some summaries from the same endowment session data I used in the last post.
But first, commenters also pointed out that I left out a huge disclaimer in that post: The data I have is only for people who schedule online. Online scheduling is still relatively new (maybe even only becoming available during Russell M. Nelson’s presidency if I remember right), and many members therefore have decades of experience just going to the temple for endowment sessions and counting on open space being available. So it wouldn’t be surprising if a substantial fraction of temple patrons don’t show up in my analysis because they didn’t schedule online. Also, to be complete, it’s also possible that people could schedule a place but then not show up for their appointment, although I’d guess that’s probably less common. In sum, the true attendance numbers are very likely higher, perhaps much higher, than what I’m showing. I’d love to hear from anyone who’s a temple worker or attender what their impression is of how many people attend without scheduling online or how many schedule online and then don’t attend. And thanks again to commenters on my last post who raised this issue and shared their experience with this.
While I’m offering that big caveat, let me tell you about two other smaller one related to data exclusion. First, in looking at utilization, I’m using only English language sessions. Utilization rates for sessions in other languages are affected by a second effect in addition to members’ general interest in attending the temple: the number of members nearby who speak the language the session is presented in. For English, there are presumably always plenty of members nearby who speak the language, so differences in utilization can be attributed more straightforwardly to differences in willingness to attend. The second exclusion of data is that I dropped all Monday sessions. Provo consistently had a few sessions on Mondays, but because it was the only temple open for endowments that day, I didn’t consistently gather the data. It’s only a small number of sessions anyway, so I just excluded all Mondays.
This first graph shows counts of total endowment session seats and seats used, aggregated across all Utah temples.
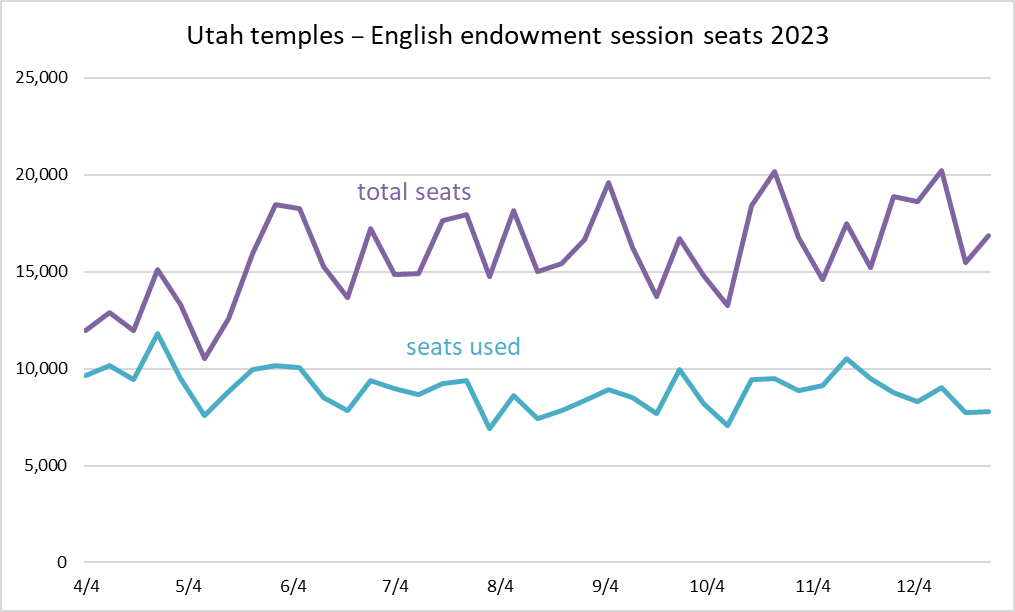
The most obvious trend to me is that there’s a real up and down in total seats that comes from different temples opening and closing for periodic cleaning. I’m sure this is all coordinated from Salt Lake to make sure that the closings are rotated, and for example, a bunch of temples in the same area don’t all close at once. There’s also an increase through the year, although it’s kind of hard to see in the cyclical ups and downs. Through May, the peak number of seats available in a week was just over 15,000, but this increased to over 18,000 in June, to nearly 20,000 in September, and then to over 20,000 in a couple of weeks in the fourth quarter of the year. The opening of Saratoga Springs in September and the re-opening of St. George in December contributed to this increase.
The number of seats used didn’t have this increase. Its peak was actually in April, at nearly 12,000, a level not reached or even approached for the rest of the year. Seats used followed seats available through May, but then flattened out and didn’t follow seats available too closely. This result is in line with what I showed last post, where a lot of patrons seemed to be going to another nearby temple when their preferred one was closed.
This next graph shows utilization. The red line is just seats used (the aqua line) divided by total seats (the purple line) in the graph above. The blue line shows what percentage of endowment sessions were entirely full. I think this second measure is interesting for a couple of reasons. First, Last Lemming commented on my last post that from an economic perspective, you’d expect temples to be built to handle peak demand. When sessions are entirely full, this indicates that more temple capacity, in the form of more temples or just more sessions, might draw even more patrons. The second reason I think it’s interesting is that when sessions are entirely full, it suggests that walk-in patrons might be getting squeezed out. (Again, I’d love to hear in the comments if you know of sessions being temporarily expanded with folding chairs or some such accommodation.)
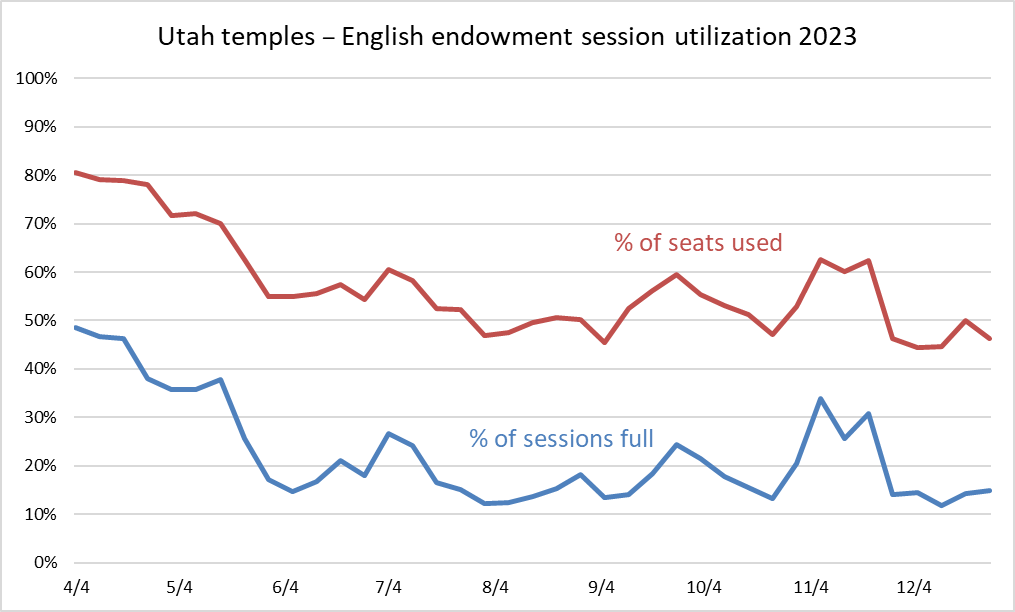
The percent of seats used line follows what you’d expect from the previous graph. It’s generally declining through the year. Like I mentioned in my previous post, I really wonder if this isn’t a seasonal pattern. If declines were actually consistently this dramatic, in a few years it seems like temples would be empty.
Another point here is that with so many sessions entirely full—close to half right after April Conference—it seems like going to the temple as a walk-in would become less attractive. If temples were mostly empty and you could always get a seat by just walking in, then there would be less incentive to schedule online. But if you only have a 50-50 chance of getting a seat, it seems like patrons would really want to be sure they didn’t have to wait.
A related point, though, is that there are probably busier times of day, and maybe patrons have a habitual time they go, and they know whether sessions are likely to be full at that time or not. These next two graphs show utilization by session time of day. I’ve put weekdays and Saturdays in separate graphs because their patterns looked a little different. Also, to avoid making the graphs too busy, I’m just showing overall seat utilization and not percentage of sessions completely full. This graph shows results for weekdays.
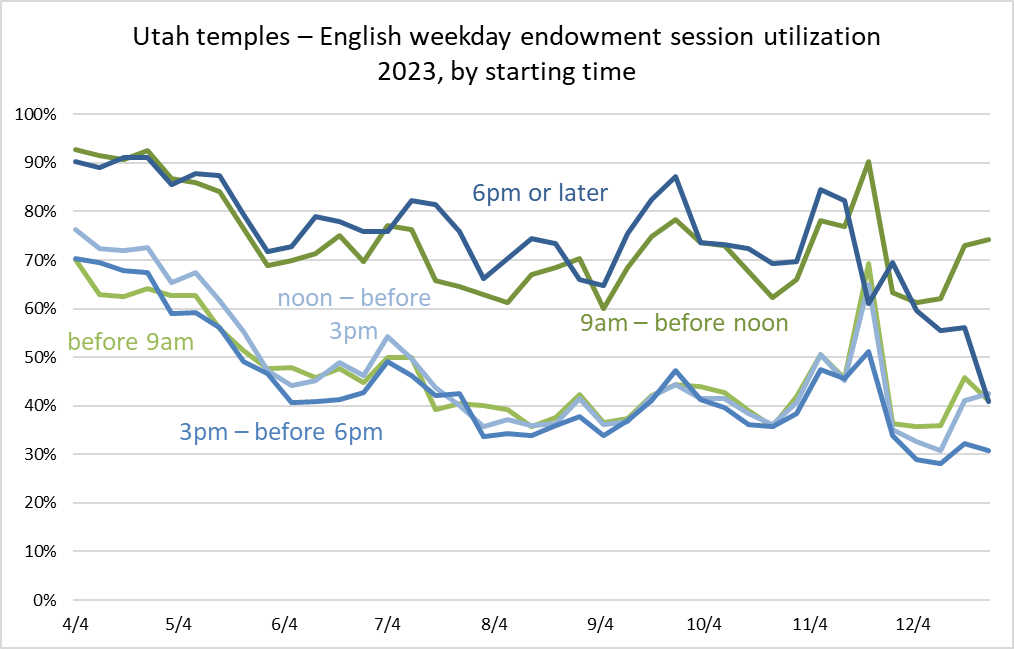
As you can see, I put the session time in three-hour bins (with all sessions starting before 9am lumped together, even if they started before 6am). The clear favorite session times are late morning (9am to before noon) and evening (6pm or later). I’m sure this is just peculiar to my family of origin or wards growing up, but I would have thought that early morning would be the favorite, as I felt like that’s always when people were planning to go to the temple.
Here’s a similar graph for Saturdays.
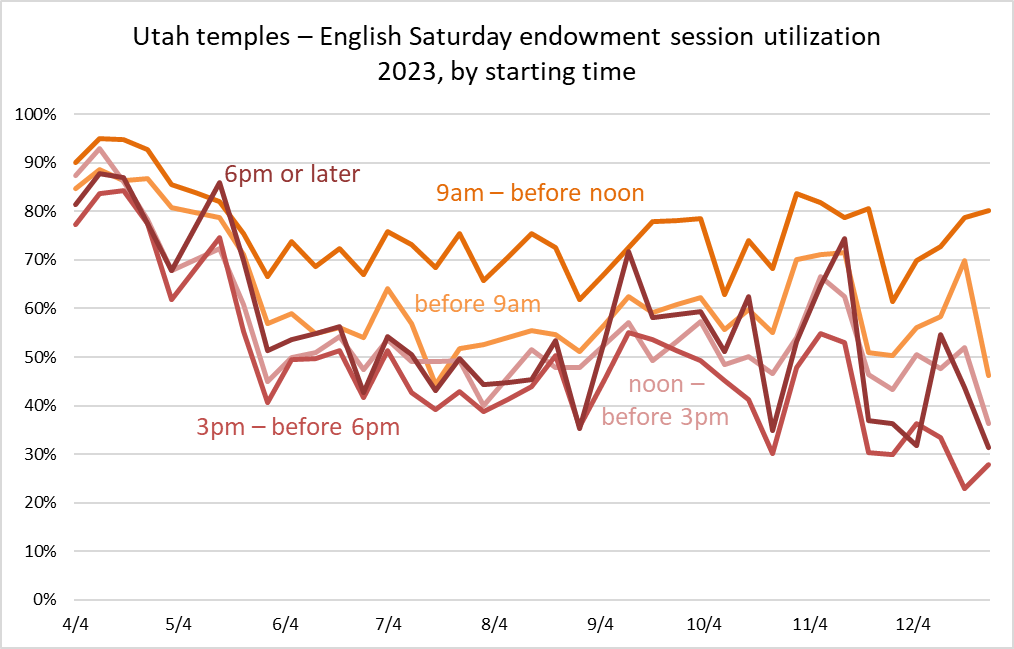
The differences aren’t as large for weekdays, but it looks like late morning is the favorite still. Evening falls back into the pack with the other start times.
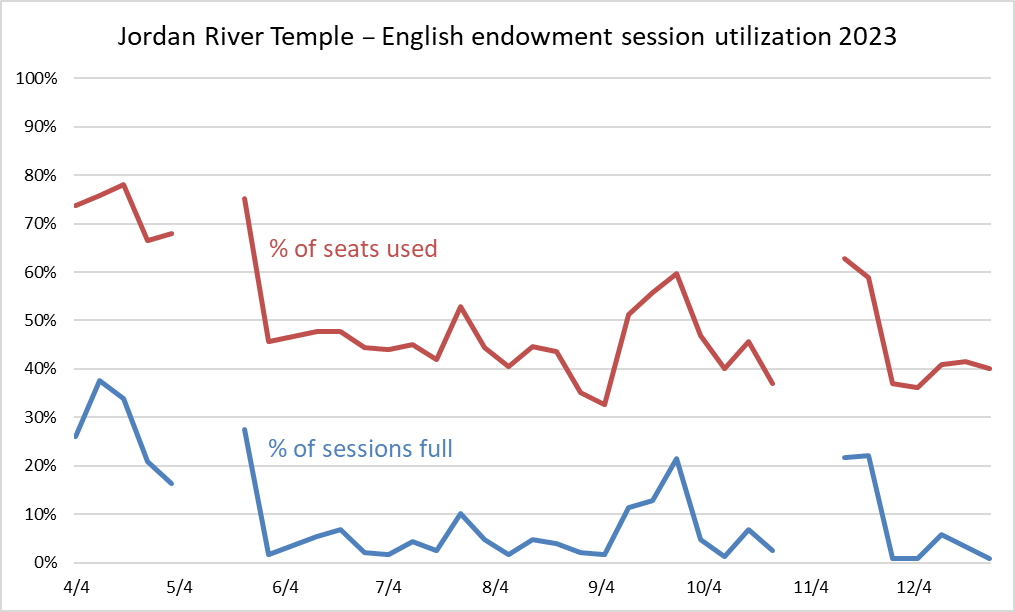
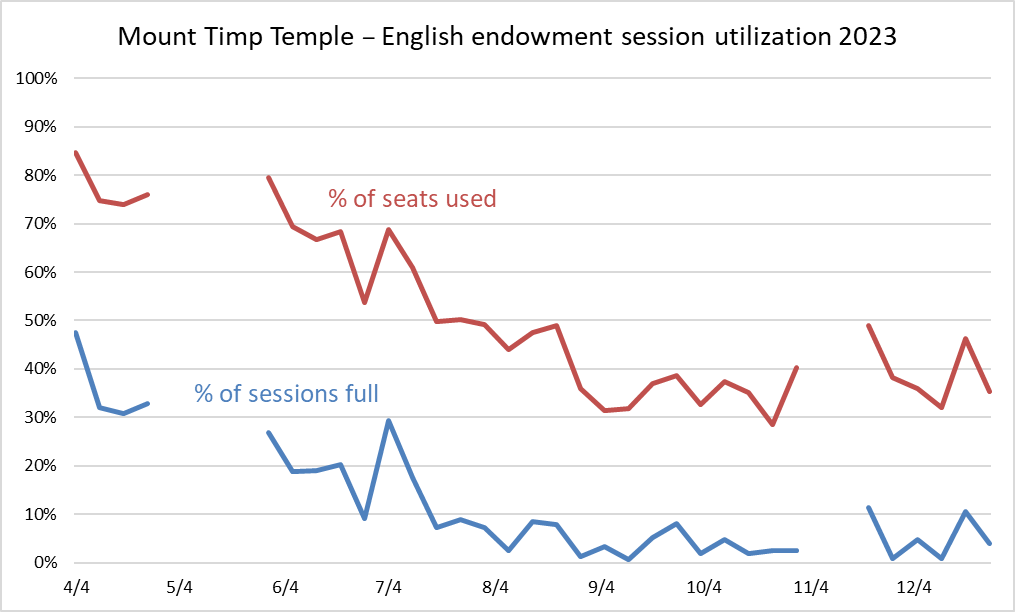
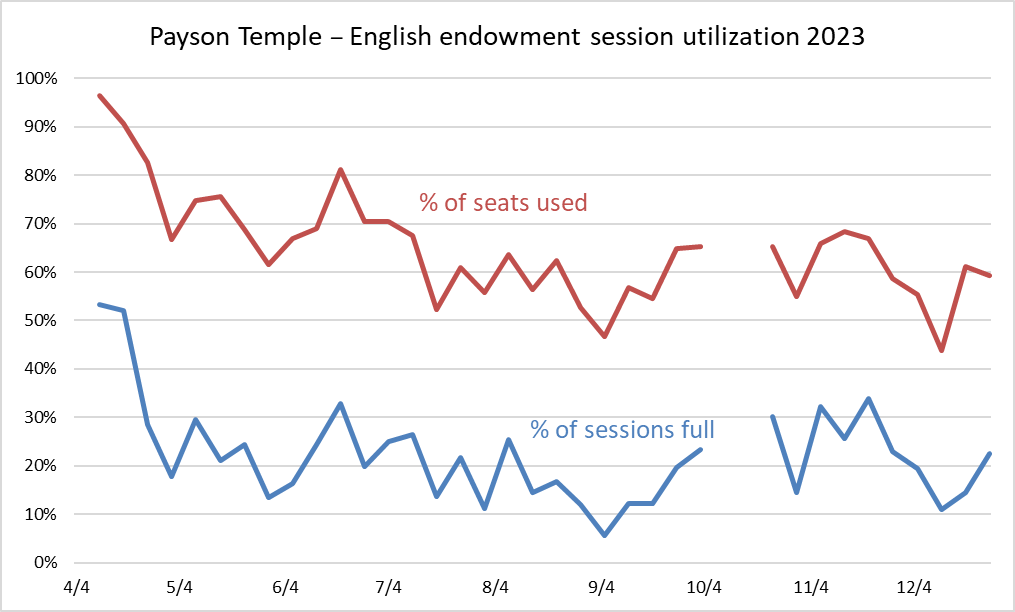
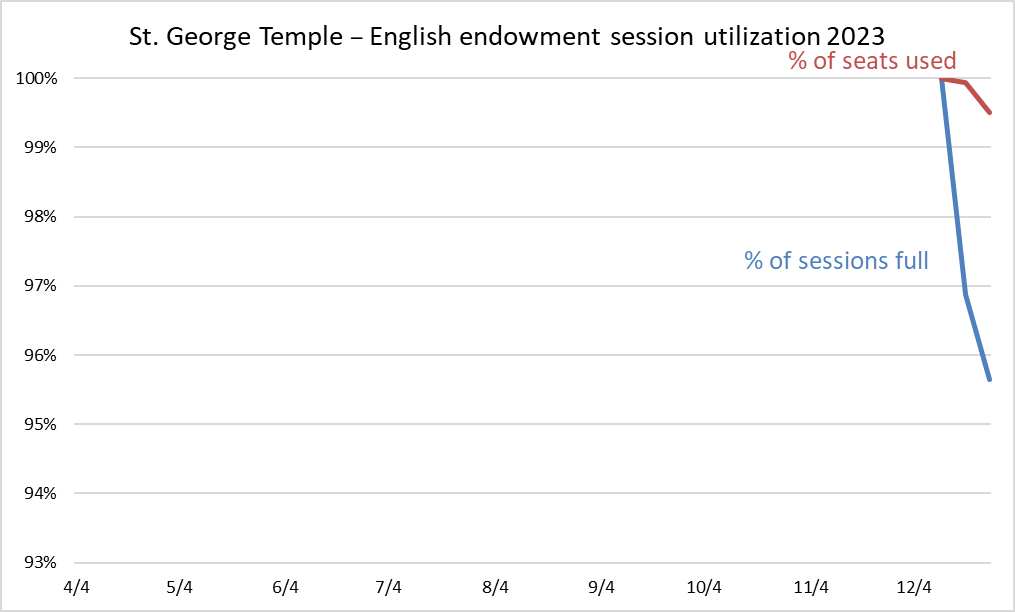
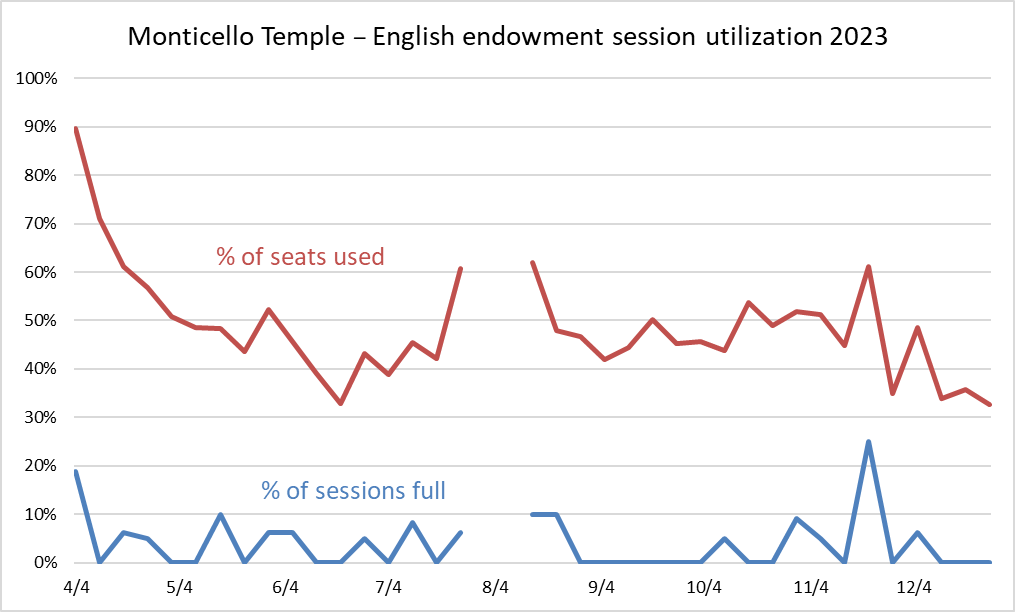
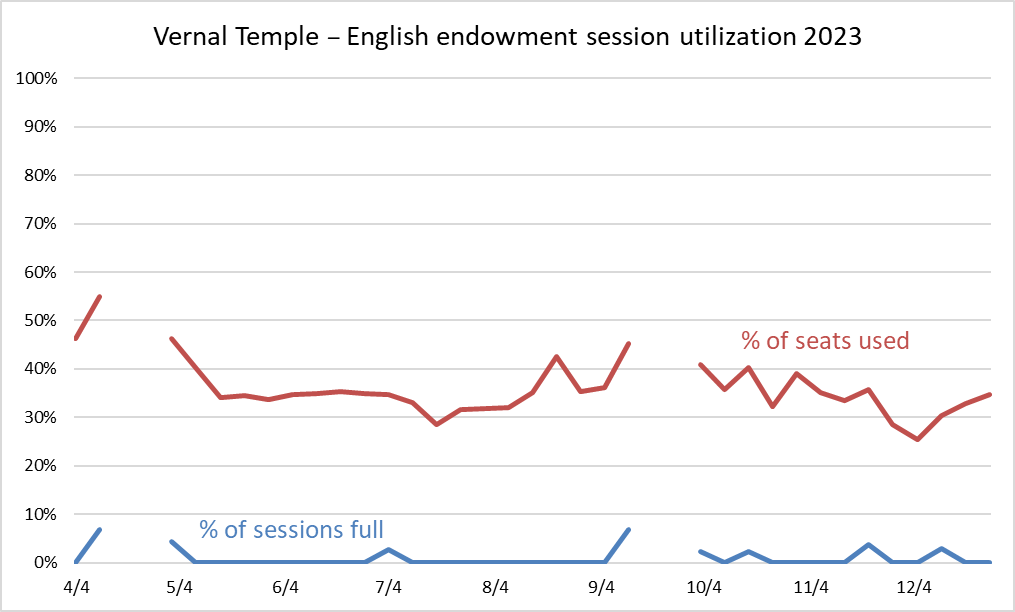
To wrap up this post, here are graphs showing weekly utilization separately by temple. I’ve ordered them from north to south in the center of the state, and the looped back south to north to get the eastern ones.
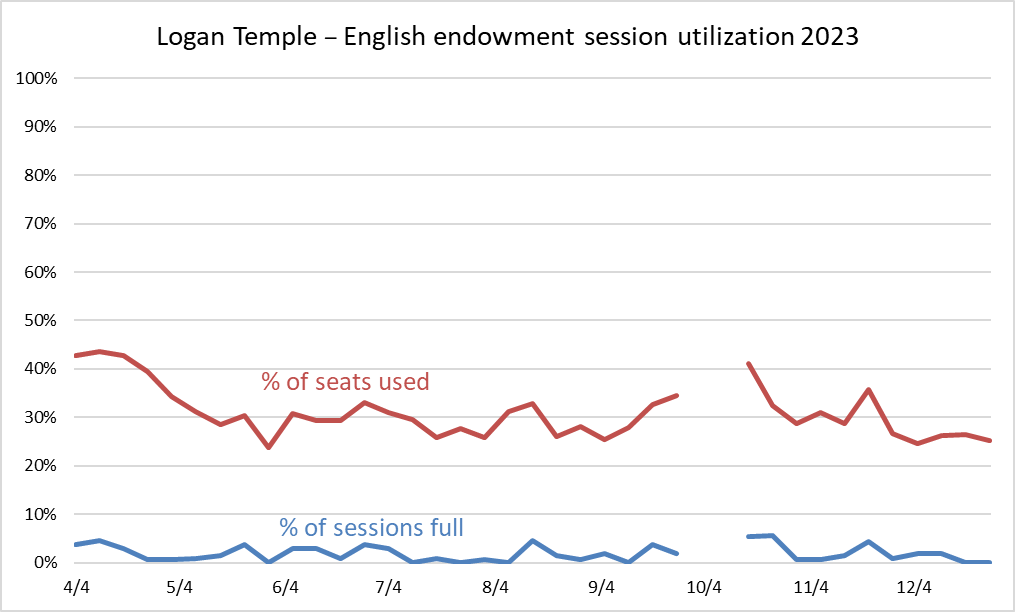
Either Logan is really under-utilized or lots of patrons don’t schedule online. It seems likely to me that the latter is the case.
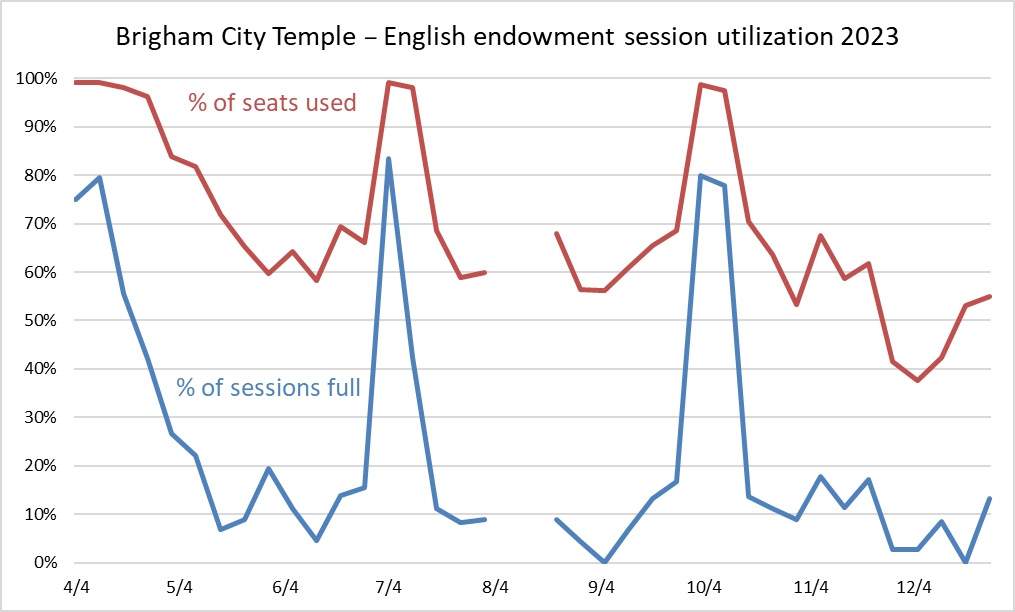
It’s interesting to see how Brigham City had big jumps in utilization when Ogden (see the next graph) and Logan were closed. This especially makes sense considering how much bigger those two temples are than Brigham City.
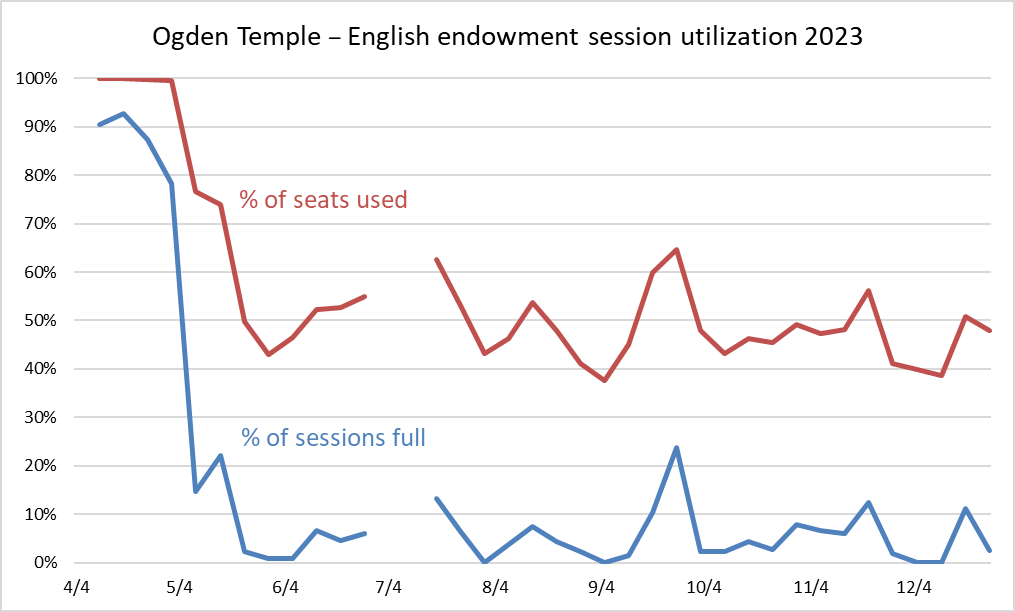
It’s part of the broader trend of generally declining utilization through the year, but I think it’s interesting that when Bountiful (see the next graph) was closed in April, Ogden was packed, but then when Bountiful was closed again in September, Ogden’s increase was much more pedestrian.
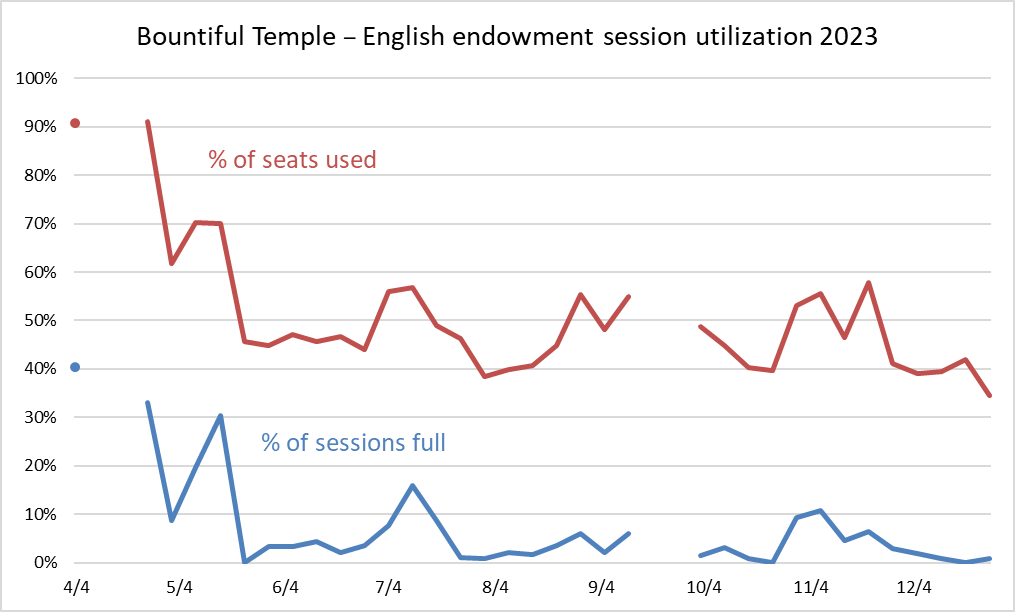
In case it isn’t clear, the dots on the left edge of the graph are part of the data series, but as I only had data for one week there before the temple closed in April, they didn’t show up when I made a line graph that just connected the points. So I added those points so they could be visible.
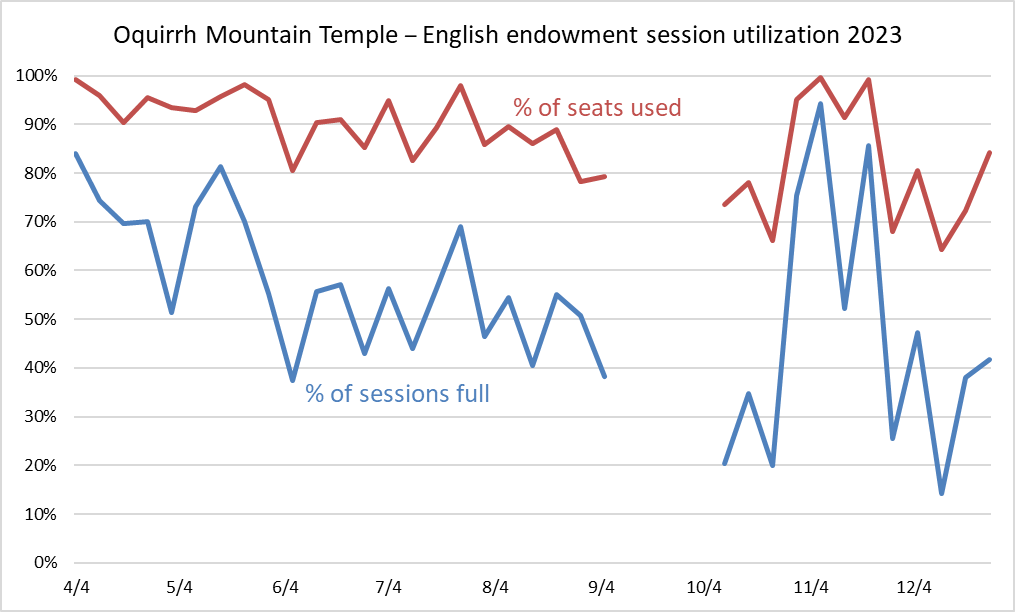
Oquirrh Mountain was a super busy temple, with no week having utilization below 60%, and most weeks being over 80%.
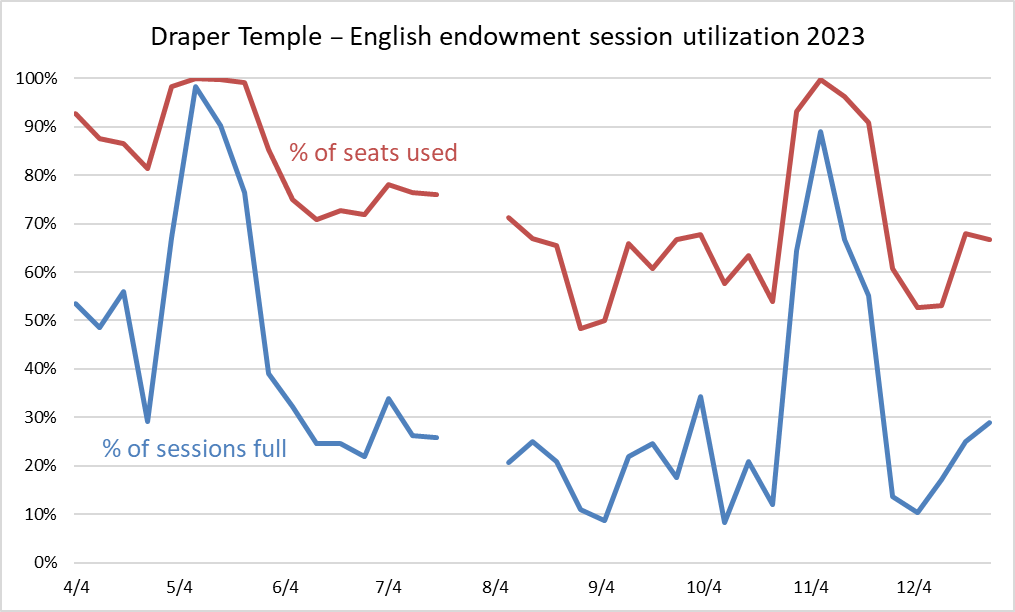
Like with Brigham City, Draper is a smaller temple that was dramatically affected by closures in a nearby bigger temple, in this case Jordan River. When Jordan River was closed, Draper was almost entirely full.
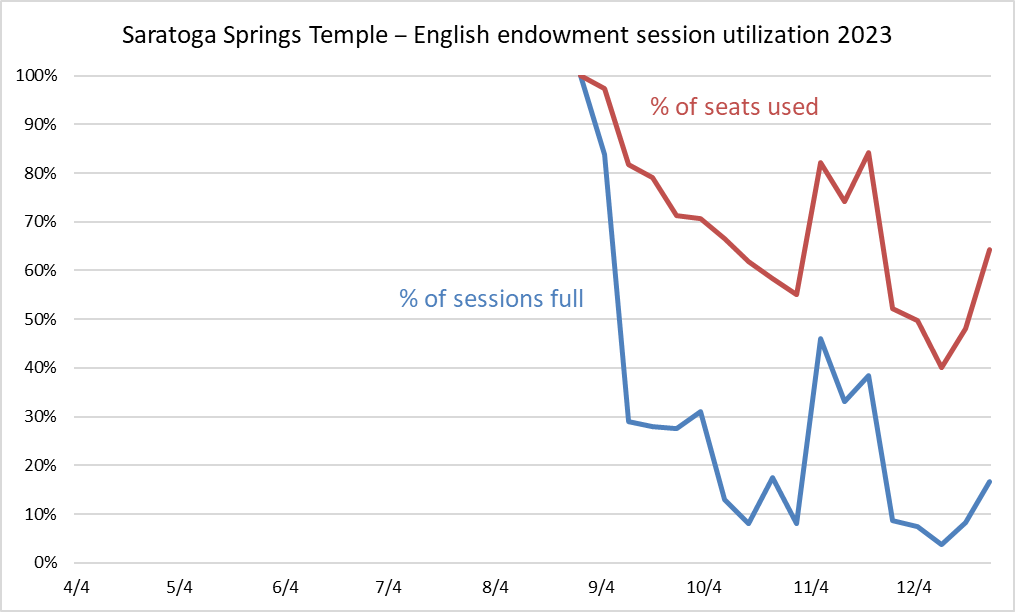
Like I noted in the last post, Saratoga Springs opened with very high utilization, which then declined consistently for a couple of months before both Jordan River and Mount Timpanogos closed at the same time near the end of the year, which pushed its numbers back up.
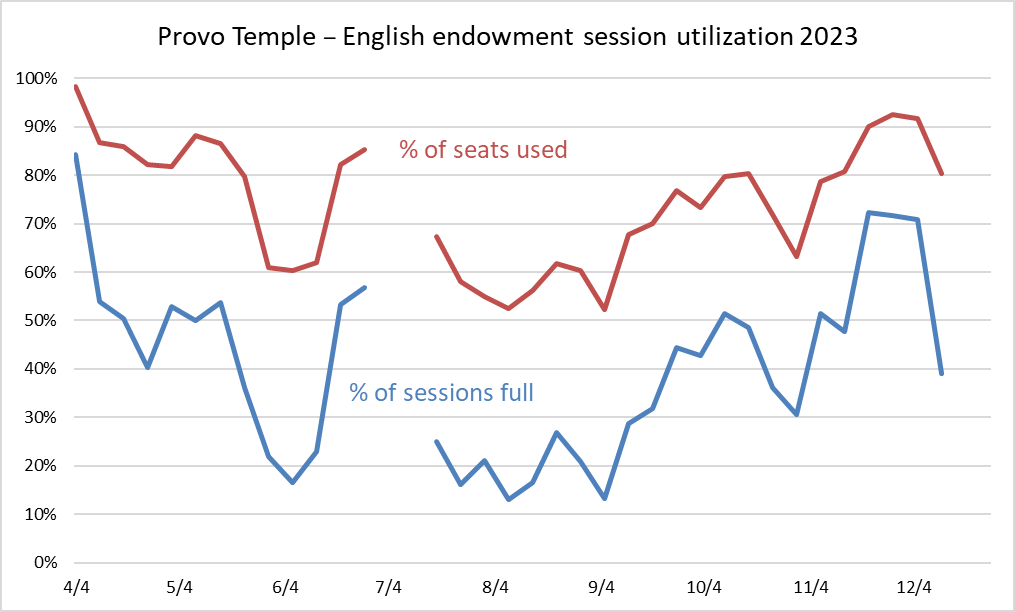
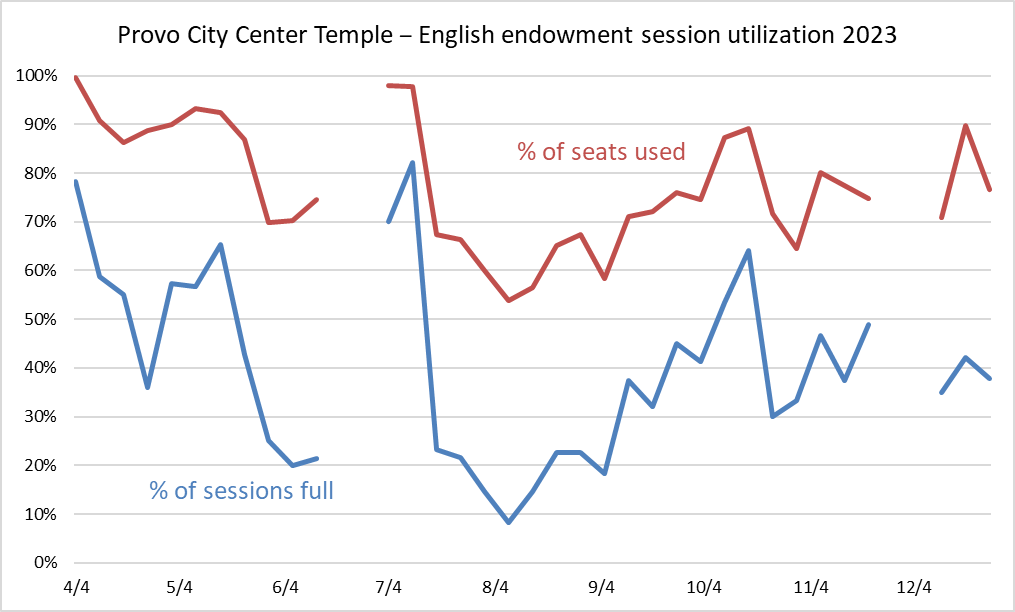
Unlike most other Utah temples, it looks like Provo had generally increasing utilization during the last few months of the year. Maybe people were going for a last visit before it was set to be closed for reconstruction starting in early 2024.
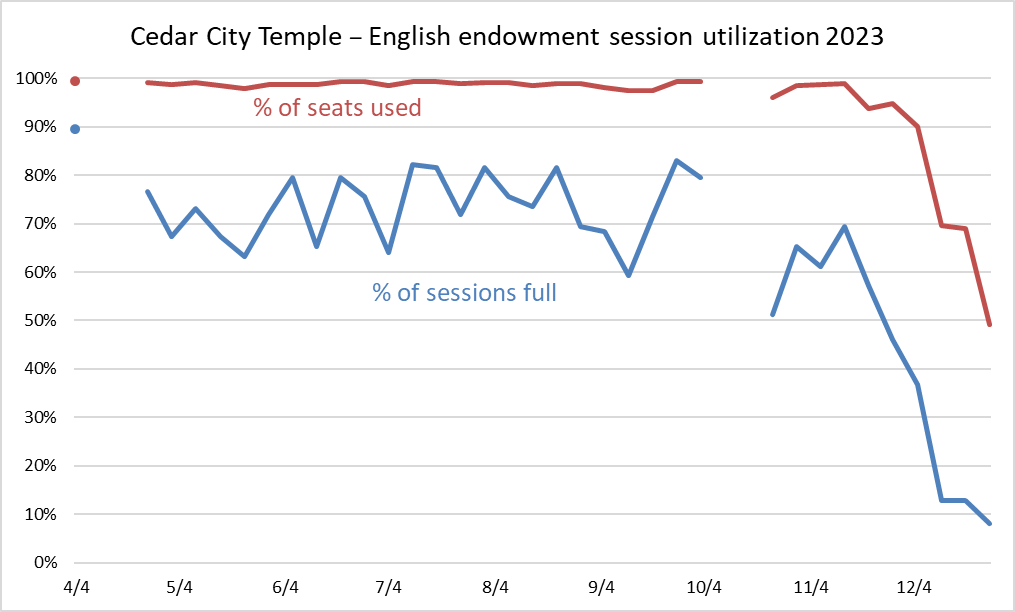
Cedar City was consistently very close to 100% full until St. George reopened near the end of the year.
Thanks for doing this.
The Logan results are just bizarre. I don’t see any interpretation thereof that would justify a Smithfield temple.
Online scheduling began when the temples reopened after Covid, and my sense (I usually attend Draper, sometimes JR or other Utah temples) is that sometimes people don’t show up for appointments and sometimes extras show up to take those spots, but generally what is reserved is how attended endowment sessions are. For baptisms and sealings, it seems to be that people optimistically schedule groups that don’t always show up, but then other groups come and hope for the best. And yes, Provo has been so busy lately with everyone bidding fond farewells.
I’ll try to keep my comments to less than 5,000 words . . . . (I love numbers, and charts)
1. Have you continued collecting the data in 2024? The new years resolution spike could be very interesting, and explain the downward trend for the year.
2. If temples are perceived to be always full, people are incentivized to reserve a spot online. So I’d expect places like Oquirrh Mountain to have few walk-ins. But if temples are perceived to be always empty, everyone knows you can just show up. So I’d expect places like Logan to have a lot of walk-ins. This potentially convolutes the data making the low utilization temples appear lower than they really are.
3. Relatedly, there is no cost to signing up for a spot and not going. At Oquirrh Mountain (my temple) if I even *think* I might want to go, I’d better sign up for a spot. I would try to be courteous and cancel the appointment when I know I’m not going, but many may not.
4. The number of seats used is remarkably flat for the year. The variation in utilization percentage seems to be mostly about how many temples are open on a given week, which is a strong argument that temple attendance in Utah (particularly the Wasatch Front) is very fungible. (In the pre-appointment days, it was generally faster for me to go to the second closest temple because Jordan River ran every 20 minutes rather than the 60 minute schedule at Oquirrh Mtn.)
5. The utilization by time of day shows what I’ve argued for years about the temple building boom (and the people who complain that we have “too many” temples). The weekday evenings are quite highly utilized, as are Saturday mornings. More temple capacity is justifiable if these numbers remain high. Yes, that leads to significant overcapacity at 1pm on weekdays. This is pretty unavoidable for people who work many jobs.
6. To every temple president who says they need scores of new temple workers, maybe you should close temples during the week, at least during the day. Between Payson and Ogden, two or three temples could be closed until 5pm on each weekday without significantly impacting most patrons. They could go other days, or they could go to other temples. Fewer temple workers would be required, temple presidents could have more free time, save a few bucks on electricity, there are all sorts of benefits. The temple can still run every evening when demand is high.
7. Temple attendance at both Provo temples is probably significantly impacted by the BYU calendar. There are many fewer students in town during the summer months.
8. With Provo closing, Orem recently dedicated, and Red Cliffs, Manti, Taylorsville and Layton (and maybe Deseret Peak?) set to (re)open in the next few months, continuing this data through 2024 could be interesting.
9. Opening Orem when Provo closed makes sense, for once. I’m baffled as to why St. George renovations weren’t done after Red Cliffs was complete. Same goes for Taylorsville and SLC.
I’d love it if you could do this for European temples
I have also been baffled by the point made in Dave W’s #9. It’s happening with Manti and Ephriam. As I recall, it also happened with Sao Paulo-Campinas and Boise-Meridian. And numerous others that I haven’t kept track of. It looks like they’re closing Orlando before Jacksonville and Tampa will be open. Maybe if we research it (there’s another job for you, Ziff), it will turn out that it doesn’t really happen as often as I think. But it seems to happen so often that it somehow appears deliberate.
Could the cellphone data be used to address activity like they did for Sunday church attendance? Devin Pope at the university of Chicago last year published along these lines.
Left Field–the Hamilton New Zealand Temple was closed for renovation from 2018-22. The Auckland New Zealand Temple was announced in 2018, groundbreaking was in 2020, and it is still under construction.
Thanks for your comments, everyone.
Last Lemming, I’m really curious about what happens when the Smithfield Temple opens. I wonder whether the Logan Temple is actually much more full than online scheduling would indicate, and there’s just a norm of not scheduling in advance and just counting on there being enough open seats. It would be interesting if the opening of the Smithfield Temple, and the likely rush of people wanting to visit a new temple pushed folks in Cache Valley to have to use online scheduling more, and then that could carry over to Logan too. Or I could be wrong and it will play out in a totally different way.
Thanks for the data point on people scheduling but not showing up or showing up without scheduling, acw! And thanks for pinning down better when the online scheduling system first became available.
DaveW, thanks for all your thoughts. Your point #2 is I think spot on. I was trying to get at something similar in the post, that I think there are likely temples with norms of scheduling online and temples with norms of not scheduling online (Logan?) and these norms are probably self-perpetuating to at least some degree. And I definitely agree on people clearly being willing and able to go from one temple to another when their first choice is closed (or full). I think your idea is also interesting that temples could cut back on sessions at times when lots of people are at work (e.g., weekday afternoons). I wonder if part of the problem is that temple workers’ and temple patrons’ schedules don’t line up nicely, with workers maybe being (I stereotype) often retired and available during the day, but wanting to be done before dinnertime.
Errol (and DaveW), I’m working on gathering some more data and hope to show more fun results in the future. Errol, for European temples in particular, in case you haven’t already seen it, you might like this post I wrote last year where I looked at the size of temples in terms of number of sessions and seats. As you probably know, a lot of the Mormon Corridor temples are both big and open for lots of sessions, so the comparison just of count of temples underestimates just how many of the available temple seats are still in the US, and in Utah in particular.
https://zelophehadsdaughters.com/2023/02/06/big-temples-and-small-temples/
Left Field (and DaveW), that’s a great question about scheduling of closures. Given how well it seems like the deep cleaning closures are coordinated, I agree that it’s surprising that the longer-term closures sometimes seem more haphazard. And NYAnn, thanks for supplying another example!
Michael, that’s a great question. I haven’t looked into cell phone data at all, but I’m guessing it could. Since I’m not an academic researcher, I’m not sure if I could get it, but it might be fun to look at if I can.
I wonder if there’s another point of data missing that could influence the data – the possibility that the online scheduling tools cap the number of available seats below the actual number of seats available in the session. This could be done to ensure there is always capacity to accommodate the walk-ins, which surely are a big component of attendees – especially amongst seniors. My experience has shown that there are always seats available in at least the next scheduled session – even if it’s a busy session. I’ve only ever had to wait until the next scheduled session – and I have not used the online scheduling tools since they made that optional (during covid the Utah temples near me required online scheduling but they don’t anymore). If this is true, your numbers (at least in terms of percentages) could be more accurate than you’re giving yourself credit for.
Left Field – there does seem to be a possible correlation with closures and openings (at least anecdotally). If true, it could be intended to create pent up demand / excitement for the upcoming new temple. That’s the only conclusion I can think of that would drive any correlation of that sort. Would be interesting to see if there is any data out there on that.
Utah needed at least 2 more temples (apparently), so I’m back to thinking about this. Are there any interesting differences in how different temples are utilized? For example, perhaps with lots of retirees, the temples in St George have a lot more demand early in the mornings, and are comparatively level loaded throughout the week? Maybe something similar for Provo temples with large student populations that have busy, but less regular schedules? Perhaps the suburban temples (Jordan River, Timp, Oquirrh Mtn, Draper, Saratoga, etc.) see the biggest swing with low utilization on weekday days, but high demand weekday nights and Saturday? Or maybe all the temples look about the same? I’m just trying to piece together why a new SL valley temple would go in West Jordan (surrounded already by Jordan River, Oquirrh Mtn and Taylorsville) and not somewhere on the east side (Holladay). And why Lehi over Spanish Fork? (And of course, more broadly, why Utah at all, but that’s already been well covered.)
Great questions, DaveW. I should take a look back and see. My memory is that there really weren’t that big differences between temples, especially not ones close to each other.
Ray E — Yes, online scheduling tools can cap the number of available seats below the actual number of seats available in the session. Payson does this. I’m unsure about others.