Who among the Q15 will eventually become president of the Church? This is always an interesting question for a couple of reasons, I think. One is that the members of the Q15, even though they typically present a united front, clearly have different visions for what the Church should be. So it actually matters who makes the top spot and who doesn’t. Of course the most obvious example of this is that Russell M. Nelson was clearly fuming about use of the label “Mormon” for decades, and it was only after he finally became Church president that he could finally impose his idea on the rest of us.
The other reason I think this is such an engaging question is that it seems so tantalizingly tractable! There aren’t a million variables and unknown unknowns to account for. There’s just this very simple succession rule, and this well-defined pool of candidates, and so who gets to become president boils down to who outlives who. And it seems like we should be able to predict that, right? Right??
Of course the answer is no, but it’s fun to try anyway. I looked at this question the same way I have in previous posts (e.g., in 2015, in 2018). On the advice of an actuary friend of mine, I use a handy mortality table (specifically, the part for white collar males, employees up until the series ends at age 80, and healthy annuitant thereafter) provided by the Society of Actuaries. I’ll explain the details at the end of the post if you’re interested, but for now I’ll just say that I can use the table to work out each man’s probability of surviving to any particular future age, and from that and the probabilities of surviving for Q15 members senior to him, his probability of being church president.
When I’ve done this type of analysis before, commenters have asked the reasonable question of whether I couldn’t make an adjustment for the Q15 members’ health. I have had two concerns with trying to do this. First, it’s hard to know how to assign levels of health in any reliable way, and second, even if I did know how healthy each of them were, I’m not sure how to adjust the mortality tables in response.
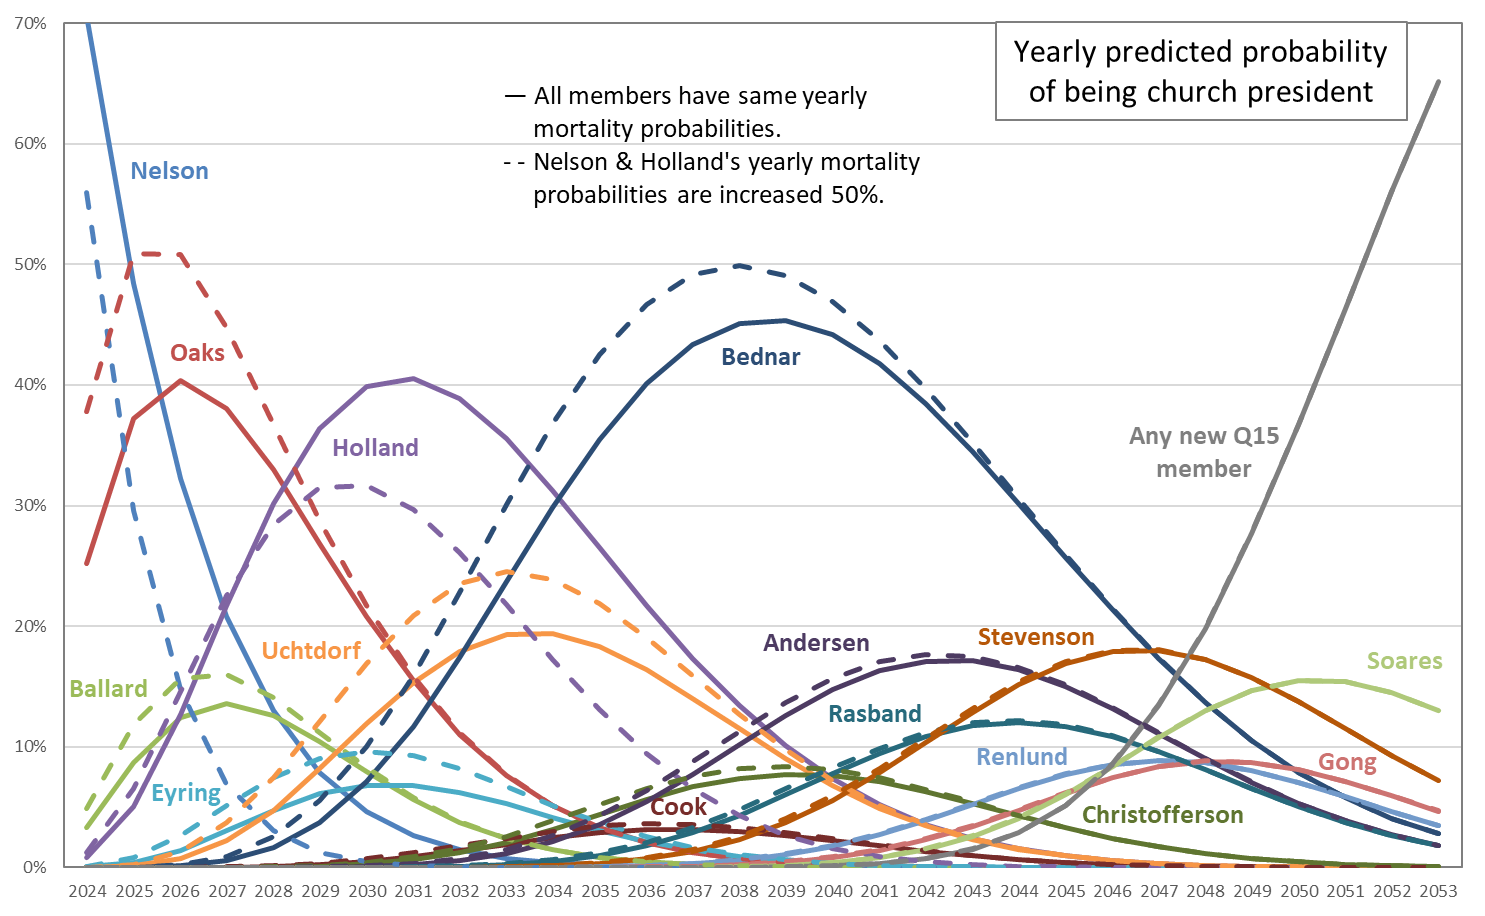
But in this post, I’m throwing caution to the wind and trying an adjustment. I’m using a very crude health categorization: I’m adjusting mortality rates only for the two Q15 members who weren’t at October Conference in person, namely Russell M. Nelson and Jeffrey R. Holland. I worked around my second concern by trying a range of possible adjustments. I adjusted the yearly mortality rates for President Nelson and Elder Holland by increasing them by 10%, 20%, 50%, and 100%. (Note that it’s really easy to mix up percentage changes and percentage point changes. These are percentage changes. So for example, if a table mortality probability is 3%, then the adjusted rates for the various increases are 3.3% [adding 10% of 3%], 3.6% [adding 20% of 3%], 4.5% [adding 50% of 3%], and 6% [adding 100% of 3%].)
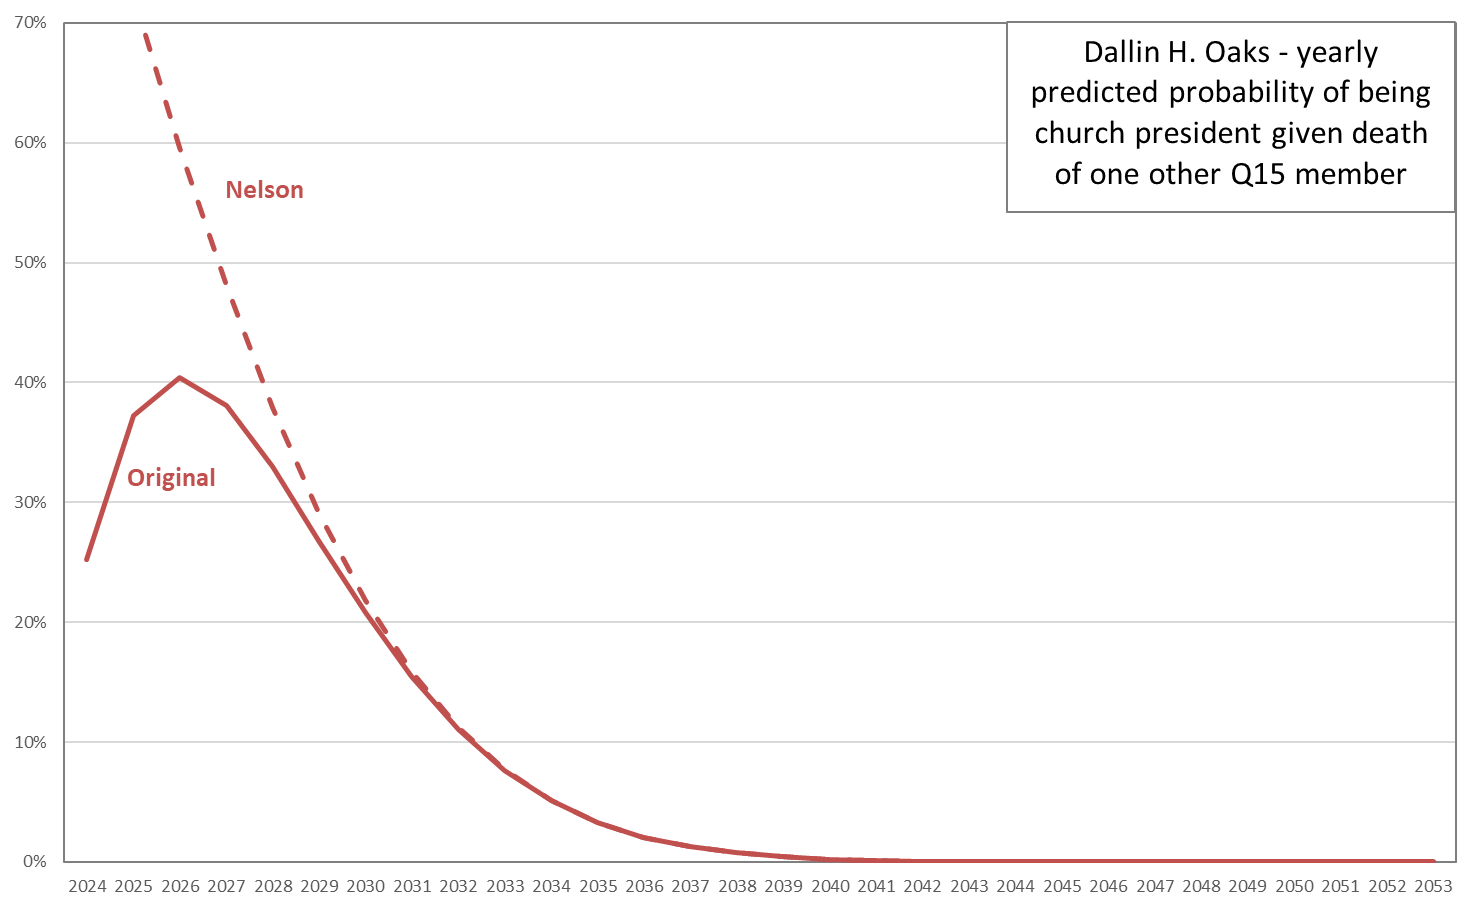
The graph below shows the probability of each Q15 member being church president for each year for the next few decades. The solid lines show the unadjusted probabilities, and the dashed lines show the probabilities with a 50% adjustment.
Read More
