Who among the Q15 will eventually become president of the Church? This is always an interesting question for a couple of reasons, I think. One is that the members of the Q15, even though they typically present a united front, clearly have different visions for what the Church should be. So it actually matters who makes the top spot and who doesn’t. Of course the most obvious example of this is that Russell M. Nelson was clearly fuming about use of the label “Mormon” for decades, and it was only after he finally became Church president that he could finally impose his idea on the rest of us.
The other reason I think this is such an engaging question is that it seems so tantalizingly tractable! There aren’t a million variables and unknown unknowns to account for. There’s just this very simple succession rule, and this well-defined pool of candidates, and so who gets to become president boils down to who outlives who. And it seems like we should be able to predict that, right? Right??
Of course the answer is no, but it’s fun to try anyway. I looked at this question the same way I have in previous posts (e.g., in 2015, in 2018). On the advice of an actuary friend of mine, I use a handy mortality table (specifically, the part for white collar males, employees up until the series ends at age 80, and healthy annuitant thereafter) provided by the Society of Actuaries. I’ll explain the details at the end of the post if you’re interested, but for now I’ll just say that I can use the table to work out each man’s probability of surviving to any particular future age, and from that and the probabilities of surviving for Q15 members senior to him, his probability of being church president.
When I’ve done this type of analysis before, commenters have asked the reasonable question of whether I couldn’t make an adjustment for the Q15 members’ health. I have had two concerns with trying to do this. First, it’s hard to know how to assign levels of health in any reliable way, and second, even if I did know how healthy each of them were, I’m not sure how to adjust the mortality tables in response.
But in this post, I’m throwing caution to the wind and trying an adjustment. I’m using a very crude health categorization: I’m adjusting mortality rates only for the two Q15 members who weren’t at October Conference in person, namely Russell M. Nelson and Jeffrey R. Holland. I worked around my second concern by trying a range of possible adjustments. I adjusted the yearly mortality rates for President Nelson and Elder Holland by increasing them by 10%, 20%, 50%, and 100%. (Note that it’s really easy to mix up percentage changes and percentage point changes. These are percentage changes. So for example, if a table mortality probability is 3%, then the adjusted rates for the various increases are 3.3% [adding 10% of 3%], 3.6% [adding 20% of 3%], 4.5% [adding 50% of 3%], and 6% [adding 100% of 3%].)
The graph below shows the probability of each Q15 member being church president for each year for the next few decades. The solid lines show the unadjusted probabilities, and the dashed lines show the probabilities with a 50% adjustment.
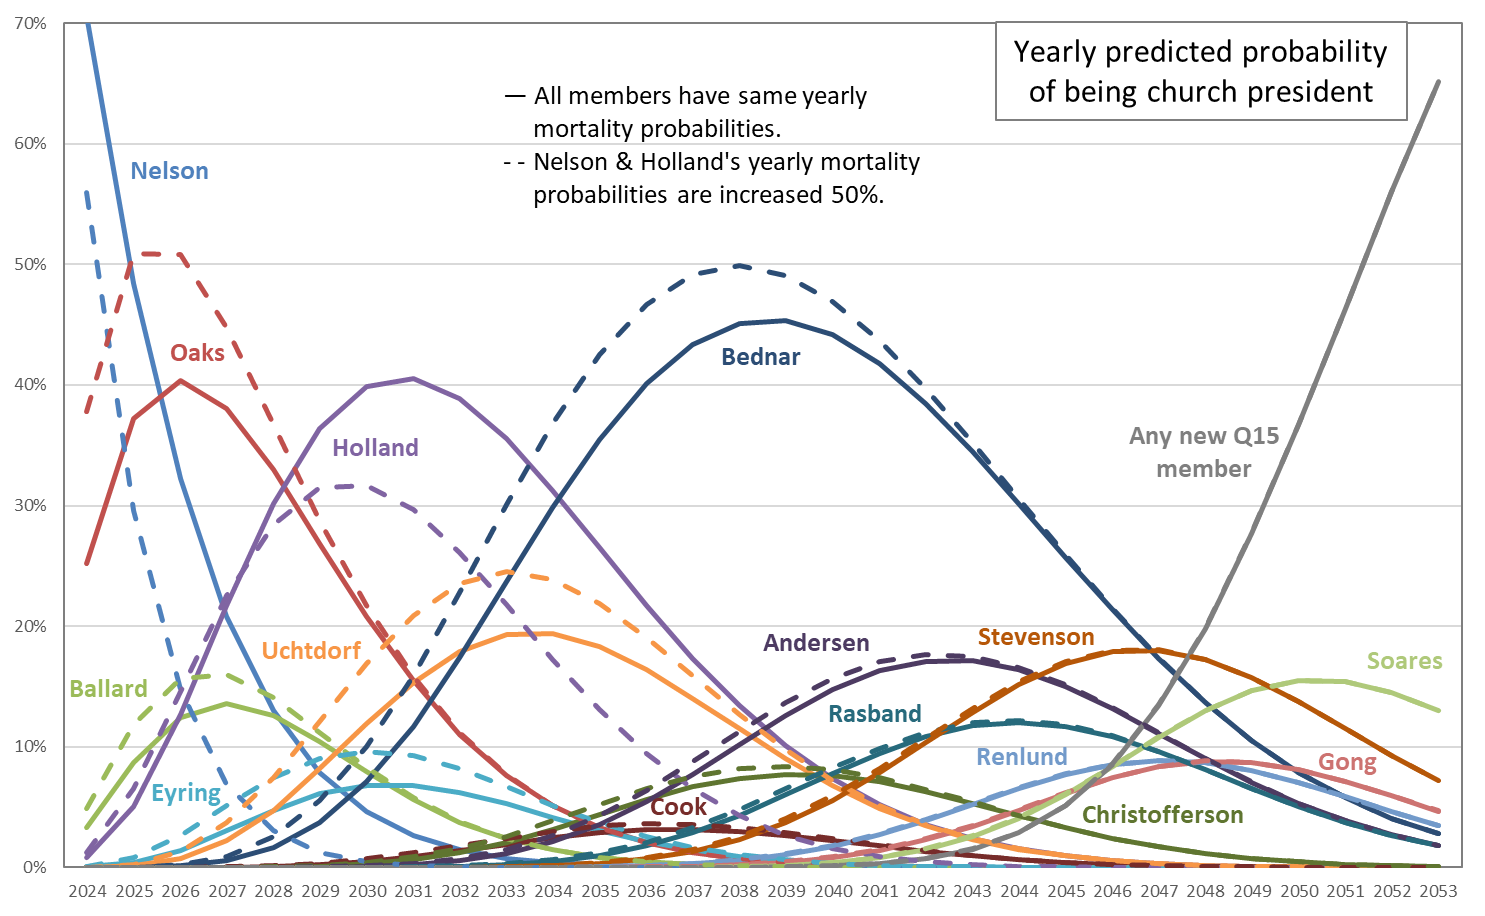
As it has been ever since I first blogged about this question, Dallin H. Oaks, Jeffrey R. Holland, and especially David A. Bednar look like the best bets to become Church president. President Oaks’s chances have declined a little as President Nelson has blocked his path by living longer than any other Q15 member ever. As you can see in the graph, if we assume the 50% higher mortality probabilities for President Nelson and Elder Holland, this would really give President Oaks’s chances a lift. It would also push Elder Holland’s down considerably, increase Elder Uchdorf’s, and move Elder Bednar’s both up and forward in time. After Elder Bednar, the changes between unadjusted and adjusted are really small, as these men were already very likely to outlive both President Nelson and Elder Holland.
I won’t bore you with all the graphs comparing the 10%, 20%, and 100% increases in mortality probability for President Nelson and Elder Holland. You can get a sense of their shape from this one. And the smaller increases (10% and 20%) really have a surprisingly small impact on the probabilities. I should note that I really don’t have any reason to prefer the 50% adjustment other than that it makes a graph where you can see some differences.
One possible clue that 50% might be in the right ballpark as an adjustment comes from comparing the “healthy annuitant” mortality probabilities in the SOA table to the “disabled retiree” probabilities. These are dramatically different at younger ages (e.g., disabled retiree is five times as large as healthy annuitant [i.e., 400% higher] at age 50), but they become more similar with increasing age, falling to being about 50% different by the early 80s, which is where Elder Holland is now. By President Nelson’s age, though, the difference has fallen to below 10%, so 50% might be an overadjustment. And of course, the validity of the comparison rests on the assumption that a Q15 member not being present in Conference is equivalent to moving him from healthy to disabled in the mortality tables. That assumption is probably not quite right, but it’s maybe not too grossly wrong.
Even setting the adjustment issue aside, it’s good to remember that this type of analysis can be totally wrong. And has been. Just look at Russell M. Nelson, who my pre-2018 analyses always showed was not a likely candidate to become Church president. But he made it anyway, and he’s been in office for years now. And going back, there’s the case of Harold B. Lee, who always looked like a really good bet to be Church president, and for a long time. He did make the top spot, but he only served for a year and a half before dying at the surprisingly young age of 74.
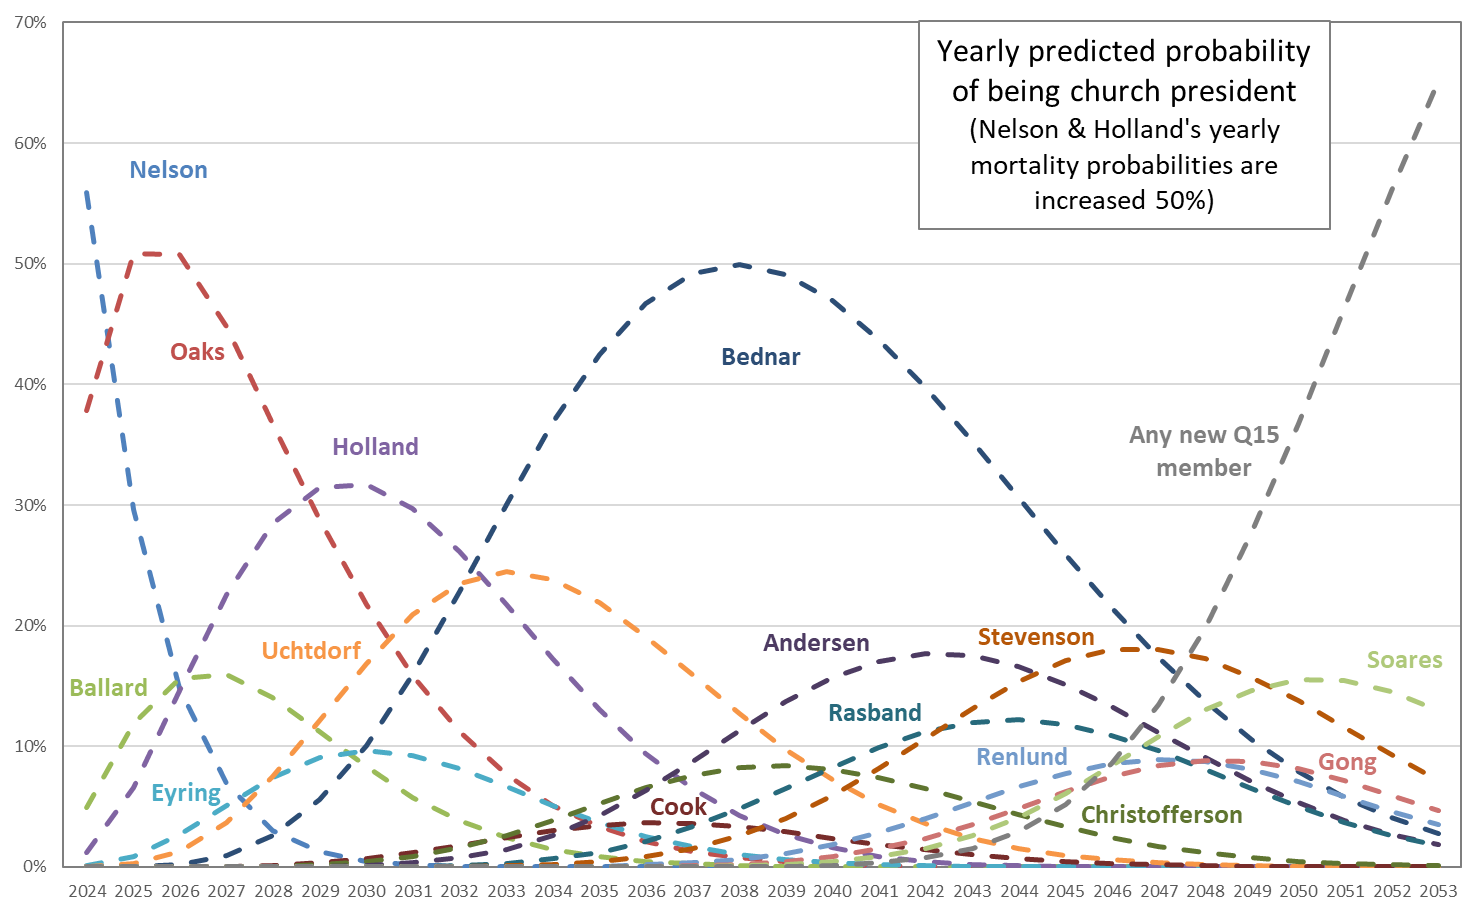
I did one other analysis where I used a random number generation to simulate 10,000 possible scenarios for each of the Q15 members’ future lifespan. (I used the same mortality table as in the analysis above. Here the question was just comparing the random numbers with the cumulative survival probabilities to come up with an age at death for each member in each scenario.) In each scenario, I checked whether each member became president, and if so, for how long. I did this process once with no adjustment, and then again for each of the mortality adjustments I mentioned above for President Nelson and Elder Holland: 10%, 20%, 50%, and 100%. This table shows the results.
The results match up to what the graph above shows. In the unadjusted results, President Oaks, Elder Holland, and Elder Bednar are the only members with a greater than 60% probability of ever becoming Church president. Adding the adjustments helps President Oaks (increase of 16 percentage points, from 62% to 78%) and Elder Uchtdorf (plus 11 percentage points, from 36% to 47%) the most. And as the graph suggests, the probabilities for all men junior to Elder Bednar are quite flat across the different adjustment amounts.
This is the end of the content of the post. Keep reading only if you’re interested in more detail on the methods.
Method
For each member of the Q15, with his current age and the mortality table, I can calculate his probability of surviving to any future age by multiplying one minus his mortality probability at each age between his current age and that future age. For example, consider a hypothetical 80-year-old Q15 member. I want to know the probability that he’ll still be living in three years. Say that his mortality probabilities for the next three years are 4%, 5%, and 6%. Then, his probability of surviving through the three years is his probability of not dying in year 1 times his probability of not dying in year 2 times his probability of not dying in year 3. In other words, it’s (100%-4%) x (100%-5%) x (100%-6%), or 96% x 95% x 94%, which equals about 86%. I do this calculation for each Q15 member for all possible future ages up to 120, when the mortality table just throws up its hands and calls the mortality probability 100%.
Once I have the survival probabilities through each future age for each Q15 member, then I change from lining them up by age to lining them up by calendar year. So now I am not labeling them as probability of surviving through age 85 or through age 90, but probability of surviving through 2024 or through 2027. Then it’s a straightforward calculation to work out each man’s probability of being president in a particular year. Two things have to happen for a Q15 member to become president: he has to survive, and all the members senior to him have to die. So each man’s probability of being president in a particular year is just his probability of surviving through that year, multiplied by the product of the probabilities of each of the men senior to him dying by that year. (For the man who’s already president, this is simplified because all the men senior to him have already died.)
For example, consider a hypothetical Q15 member who’s in seniority position 3, and I want to know the probability that he’ll be president in five years. Say that the survival probability through five years for the top two members are 40% and 50%, and the survival probability through five years for the Q15 member in question is 75%. Then the probability he’ll be church president in five years is (100%-40%) x (100%-50%) x 75%, or 60% x 50% x 75%, which equals about 23%.
Note
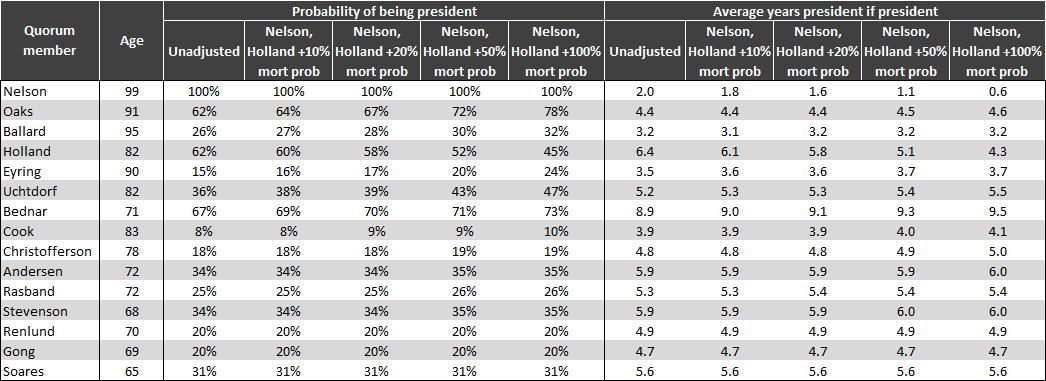
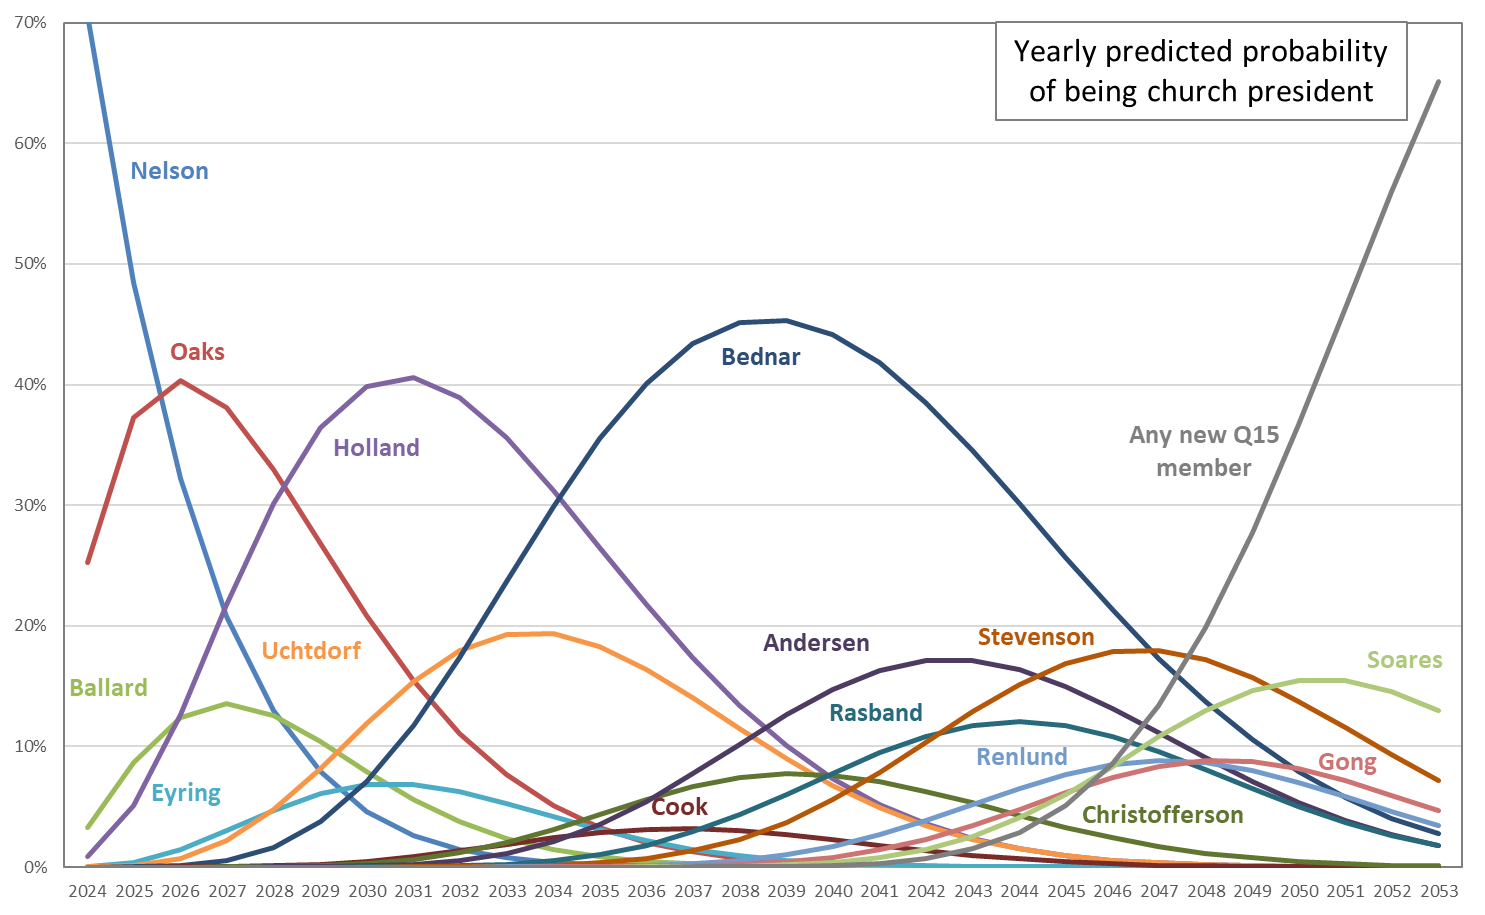
The graphs below show the unadjusted and 50% adjusted probabilities from the graph in the post, but in separate graphs, at the request of Last Lemming.
This is exactly the content I come here for. Some thoughts:
1. It feels pretty arbitrary to pick two of the 15 as the unhealthy ones, given how little is typically revealed about their health. But seeing how that affects the graph is still interesting.
2. Another potential adjustment would be recalculate based on marital status. There are many studies documenting the impact that losing a spouse has on life expectancy, particularly for men. Holland and Eyring have both lost their wives this year. Nelson and Oaks have been remarried for a while. Ballard has been widowed for a few years. I don’t know if the increased mortality is a short term effect, or if it continues, or how remarriage impacts things. But if I were to do something as macabre as speculate on the death of an apostle (which I would never do!) my money would be on the three bachelors.
2a. We’re currently in the 4th longest stretch without a change to the Q15 since WWII, and the average age of the Q15 is 8 months shy of setting a new record. Curiously, in recent times, we’ve lost apostles in groups. No one died from 2009 to 2015, and then Packer, Perry and Scott all went in a short span. 3 years later, Monson and Hales went a few months apart.
3. While I doubt the Q15 read this blog, at a gut level, they must understand these things. I can’t begin to imagine how it must feel to be Bednar, knowing that you have a 70% chance to become president of the church, and are likely to be president for a significant time, but not for roughly another decade. Something like that would definitely mess with my head. I wonder if he can get on the phone and talk to King Charles about what it’s like.
4. I’d be curious to see some of the outliers in your 10,000 simulations. Are there any crazy scenarios where Nelson makes it to 110? Bednar assumes the presidency for 30+ years? I suppose you’re calculating only on yearly intervals, so we can’t look for any 1 day presidencies.
Would it be too much to ask that you present your data in two charts–one without the adjustment and one with? I’m pretty good at reading these things and that one made my head hurt.
I always love these posts and have been hoping you would do an update, so thank you! I’m really really hoping for an Uchtdorf presidency—happy to see it’s not entirely off the table. On a bit of a tangent, I find it interesting that 5 of the 7 Q15 over 80 are widowers, even though women typically live longer than men. I just looked it up: 67% of all those 85 and older are women. I wonder if being busy and important keeps you young, while being silently supportive ages you. A friend of mine attended conference with the apostles’ wives a few years ago; one of them said something to the effect of, “We need to take good care of ourselves—we all know if we die we get replaced.”
I’d like to see the age of their parents be a factor somehow. (Things like Elder Oak’s dad dying young probably would mess his up)
Nelson (99) mom died (90) dad died (93)
Oaks (91) mom died (73) dad died (37)
Ballard (95) mom died (79) dad died (85)
Holland (82) mom died (95) dad died (66)
Eyring (90) mom died (73) dad died (80)
Uchtdorf (82) mom died (82) dad died (62)
Bednar (71) mom died (73) dad died (85)
Cook (83) mom died (88) dad died (89)
Christofferson (78) mom died (87) dad died (94)
After this point it’s harder to find information.
Thanks for your comments!
DaveW, I agree about the kind of arbitrariness of just selecting out two men to adjust probabilities for. But I also like that it’s such a concrete criterion: either they were there at Conference or they weren’t. I don’t have to make any judgment calls! I also had thought about the married vs. widowed difference too. Maybe I’ll try that in the future. And sorry, on the outliers in the simulation, I suspect they’re in there. I’ll have to check back.
Last Lemming, I’ve put separate versions of that graph at the bottom of the post.
Dot, thanks for sharing that. Oof, but that’s a sad reality to consider. Polygamy, and the threat of it, is sure alive and well among GAs!
Katrina, you might like my 2021 post (which I should have linked to before), where I tried looking at that. I didn’t find that it made much difference, other than some movement for Dallin H. Oaks.
https://zelophehadsdaughters.com/2021/04/22/church-president-probabilities-adjusted-for-q15-parents-lifespan/
That helps. Thanks.
Regarding the significant number of widowers, I imagine this is a case of survivorship bias. You don’t become a senior apostle without being an unusually old man. It would be interesting to compare the age at death of apostles’ spouses to the actuarial tables.
I did some analysis earlier this year on the overall age of the apostles:
qhspencer.github.io/lds-data-analysis/apostles
The average age of the quorum was around 70 for decades in the latter half of the 20th century, but it is has been above 75 for about the last 20 years. They are older than ever, and have likely now reached an all-time high, surpassing the previous mark set around 2015.
Like other commenters, I’m holding out hope for the Uchtdorf presidency. It’s a bit of a morbid game thinking about all of this, but with this succession scheme it’s inevitable. They could change it if they wanted.
Dot: My jaw hit the floor when I saw your comment. Disturbing. I hate to think of being so easily replaced after years of sacrifice, support, and doing everything I can to help fulfill another person’s dreams. I’m single and childless and would like to be married, but the thought of being seen as disposable regardless makes me wonder if I’m better off going my own way, especially if it means taking on the stepmother role and all the complications that entail. I don’t know how Wendy Nelson and Kristen Oaks did it.
I’ll toss my ring into the hat with those hoping that Uchtdorf takes the reins. I feel like he’s the one who would make impactful and lasting changes that’ll help ALL of God’s children and make the church a better place for EVERYONE, not just a select few.
Nothing to add, except admiration and gratitude. You’re such an asset to the Bloggernacle, Ziff.
The comment about the count of current widower apostles caused me to wonder: Of those apostles who died most recently, which and how many of them died before their first wives, and how many left widowed first wives? Looking at a list of current living apostles could only tell half that story. So:
Monson, wife died first, 0/1
Hales, husband died first, 1/1
Scott, wife, 1/2
Packer, husband, 2/2
Perry, wife, 2/3
Wirthlin, wife, 2/4
Hinckley, wife, 2/5
Faust, husband, 3/5
Haight, husband, 4/5
Maxwell, husband, 5/5
Hunter, wife, 5/6
Benson, wife, 5/7
Ashton, husband, 6/7
Romney, wife, 6/8
Kimball, husband, 7/8
McConkie, husband, 8/8
Petersesn, wife, 8/9
Richards, wife, 8/10
With the death of Donna Smith Packer last year and Mary Crandall Hales at the beginning of this year, there are currently no living widows of deceased apostles. I suppose this is the first time for that since 1869 when Ezra T. Benson left Pamelia Andrus Benson a widow. The current aged, once-widowed group of apostles is an anomalous group. That 8/10 count from Thomas Monson to LeGrand Richards appears poised to shift to 13/10 in the next few years after Nelson, Oaks, Ballard, Holland, and Eyring die; maybe 13/11 if Uchtdorf, Cook or one of the others also dies before his wife in the next few years.
John: it already is at 13/10. We don’t need to wait for both husband and wife to die to add them to the tally.
Quentin: It’s not survivorship bias. While apostles aren’t exactly young when they’re called these days, they’re all in their 50s and 60s and have living spouses at the time of their call. There’s no reason to expect that the men would outlive their wives, unless perhaps there were known medical issues at the time of their call.
Also, the current group of apostles is still 8 months shy of hitting the all-time age record from 2015. That group got over 80 years old on average just before the deaths of Packer, Perry and Hales.
Isn’t it currently 8/15? Nelson, Oaks, Ballard, Holland, and Eyring have all outlived their first wives. Thanks for making that list, John. I’ve been meaning to do that and never got around to it.
JC Yes—I was pretty shocked and saddened by that comment.
Yes, Dot, 8/15. Thanks for the correction. I switched columns incorrectly when adding those five living widowers.
Thanks everyone for your comments.
Quentin, thanks for the pointer to your work. I’ll have to take a look! Also I totally agree with your very last point that if the Q15 didn’t want randos like me speculating about when they’ll die, they could change the succession rule so that it wasn’t based on death.
JC and Quentin, I agree on Elder Uchtdorf. I really hope he makes the top spot. And JC, I’m sorry about the specter of polygamy that looms so close over the Church, and particularly over GAs and their wives. I really wish a Church president would have the courage to just denounce the whole thing, even though it would mean denouncing the whole early Church.
Ardis, thanks! That means a ton coming from you!
John and Dave and Dot, thanks for the commentary and analysis on how often Q15 members outlive their first wives.
I left the following comment years before, but will again. The November 28, 1960 Time magazine for whatever reason included a report of a visit by Joseph Fielding Smith to Brazil (“Religion: The Senior Apostle.”). Smith at that time was 84 years old, an apostle in the Quorum of the Twelve since 1910, and president of the quorum since 1951 when David O. McKay became president of the church. At the time the article was published, McKay was 87 years old and would continue as president of the church for another nine years. The article ends with Smith saying “Think of all the Mormons who have to die before a man gets to be president.”
There you have it, the president of the Quorum of the Twelve inviting you to contemplate that which you do with your church president probabilities posts.
https://content.time.com/time/subscriber/article/0,33009,871857-2,00.html
Thanks for the validation, John!
Thank you for your post, they are always interesting. I know it will change the probabilities very little, but I would like to see an updated graph now that Elder Ballard passed away.
All the best.