I’m getting ready for the Church to release the new hymnal, although I realize it will be a while still before it comes out. In preparation, I’ve been looking at some comparisons of the current 1985 hymnal with the one that preceded it. From Wikipedia, it looks like the previous hymnal was released in 1948, revised in 1950, and added to just a little in 1960. The copy I own has a copyright date of 1973, but it looks like it’s just the 1960 version (although I can tell that its preface from 1973 because it is signed by the First Presidency of Harold B. Lee, N. Eldon Tanner, and Marion G. Romney).
One difference between the two hymnals that I’ve noticed is in the hymns to be sung by men versus those to be sung by women. More particularly, the difference is in the moods used to describe how the hymns are to be sung. By “moods,” I mean the one- or two-word adverb descriptions written at the top of the hymn. For example, the current hymnbook says that hymn #1, “The Morning Breaks” is to be sung triumphantly. In the 1973 hymnal, the moods for men’s hymns aren’t too different from the moods for women’s hymns. In the 1985 hymnal, the moods for men’s versus women’s hymns are more markedly different. Because there are a lot of different mood words assigned to the hymns, I lumped them into three groups for convenience in display. Mood words like boldly I called “high energy.” Mood words like reverently I called “holy.” And mood words like peacefully I called “low energy.” Here’s a graph comparing the hymns for men and for women in the two hymnals.
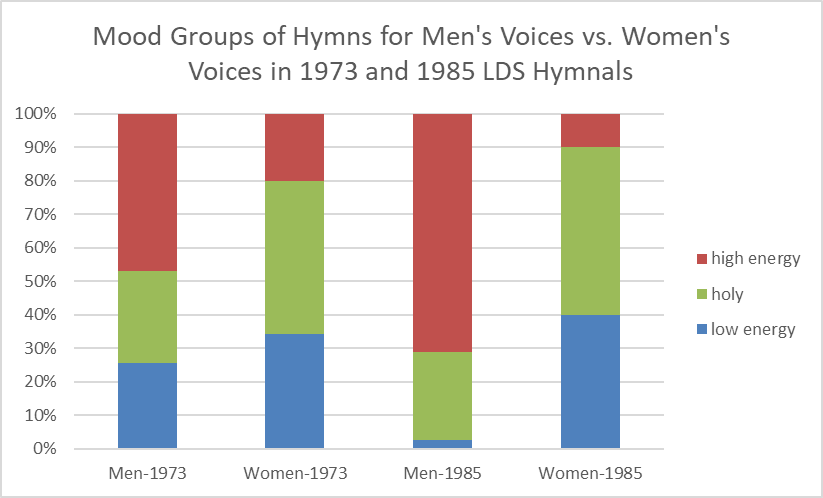
The total number of hymns specifically for men or for women was much larger in the 1973 hymnal (47 for men; 41 for women) than in the 1985 hymnal (19 for men; 10 for women). As you can see, in the graph, I’m showing percentages instead of counts to make the comparisons easier to look at. (Note that six of the 41 women’s hymns in the 1973 are excluded from the comparison because they either have no mood description, or they have a tempo word in place of a mood description.)
In the 1973 hymnal, there’s some tendency for men to be assigned more high energy moods and women more holy and low energy moods. In the 1985 hymnal, this difference gets much larger, as over two thirds of men’s hymns have high energy moods, and only 10% of women’s hymns do. This isn’t at all a surprising difference to run into. I am disappointed, though, to see that the hymn selectors’ ideas of traditional gender roles, with active men and passive, worshipful women, is translated into the hymns they select and the moods they apply to them. I hope that the new hymnal doesn’t feature such a difference, but I’m guessing that it probably will.


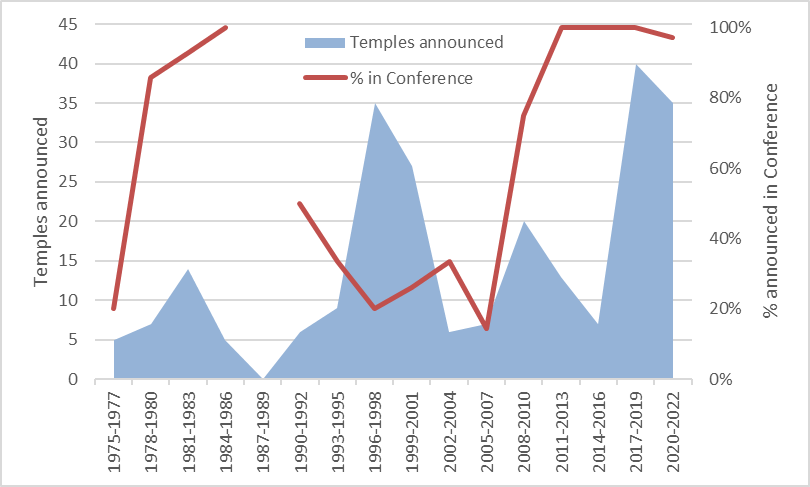






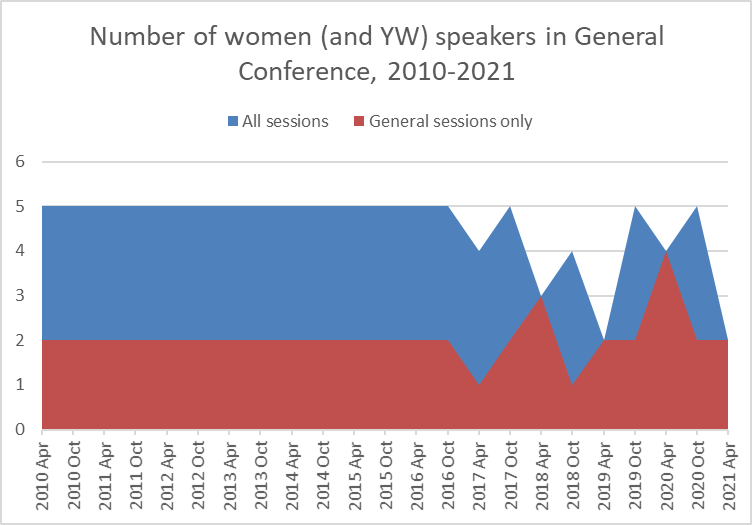 Up until the women’s session and priesthood session started alternating in April and October, there were typically two women speaking in the general sessions, plus three more in the women’s session. (The graph includes the RS and YW meetings before they were official Conference sessions.) It seems likely that two women speaking per conference is the norm we’ll go back to. This change will flow through to the rest of the curriculum too, which is so much all Conference all the time now, and we’ll hear from hardly any women at all. I’d like to hope that this was an unintended side effect of the change, but I also wouldn’t be surprised if it was a very much intended effect.