How many women will speak in General Conference now that the Church has announced that it’s discontinuing Saturday night gender-specific sessions? This was the major question I asked in my post last week on this change. I worry that we’ll go back to just having two women speak per Conference, the norm for the last several years when you ignore gender-specific sessions. Some commenters on the post were more optimistic that there would be more, though.
I was wondering about which other group of speakers (i.e., holders of what position–Seventies, Q12, or whatever) might have their speaking opportunities reduced to make space for more women speaking. I thought it could be helpful to look back at recent history, to see how many speaking slots the different positions have been allocated. I went back to 1960, because that turned out to be a good compromise between getting a good amount of data and me running out of energy.
Of course the total number of talks per Conference isn’t constant. This graph shows the average number of talks per Conference each year. I’m showing the average each year instead of showing the talk counts Conference by Conference because there’s often a lot of up-and-down noise between April and October (for reasons like the statistical and auditing reports only occurring in April) that makes the trend across time harder to look at. Averaging each year smooths those little ups and downs out, although you can see there’s still plenty of year-to-year variation.
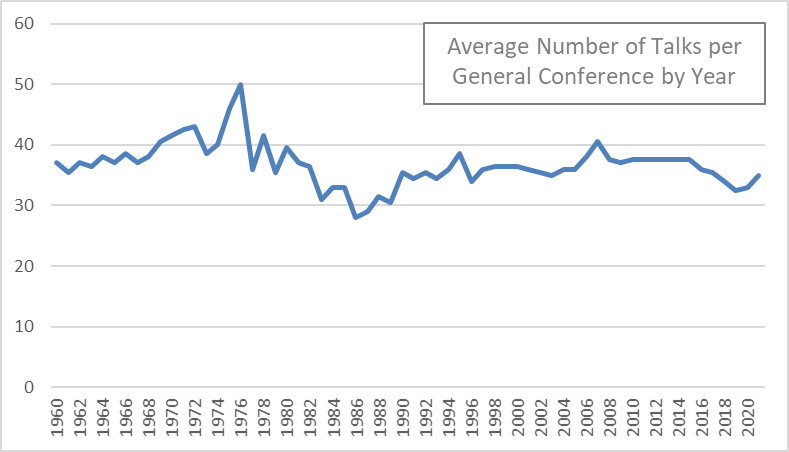
The average number of talks has been pretty flat since about 1990. Before that, there were some ups and downs caused by things like the addition of the Welfare Session from the mid-1970s to the early 1980s, the dropping of the third day of Conference in the mid-1970s, and the addition of sessions for women and YW in the 1970s, and then later the splitting of them into separate sessions that alternated in the 1990s. (I know that these sessions weren’t considered official sessions of Conference until just the last few years, but they’re published alongside Conference, so I’m counting them as part of it.) This next graph shows the breakdown.
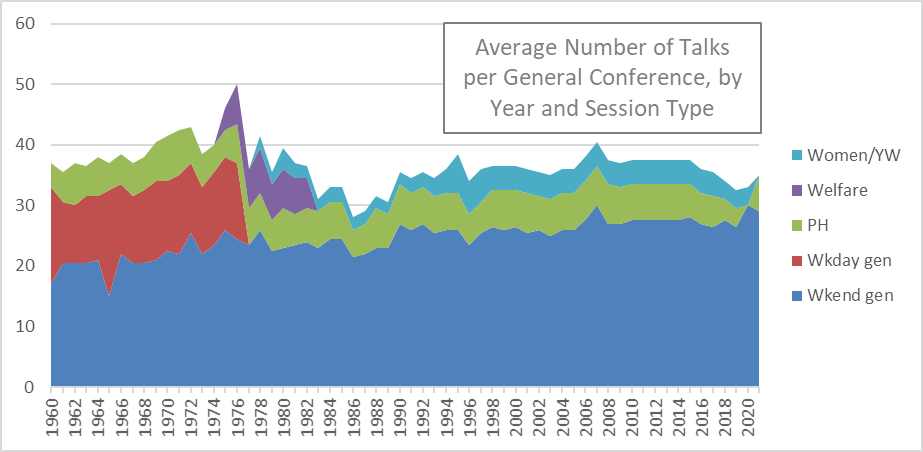
You can see here that the mid-1970s spike occurred because the Welfare Session (purple) was added just before the third day of Conference (weekday general sessions) was dropped. I’m guessing that the addition of Welfare Session might have actually caused the dropping of the third day, as not even we meeting-loving Mormons love meetings that much!
Anyway, getting back to what I’m really interested in, this next graph shows percentage of talks each year by the speaker’s position. I’ve switched from showing average counts to showing percentages because the differences in counts are kind of a distraction. The key question is, given whatever total number of speaking slots the GAs plan to have for Conference, whatever that number is, what percentage are allocated to speakers in different positions?
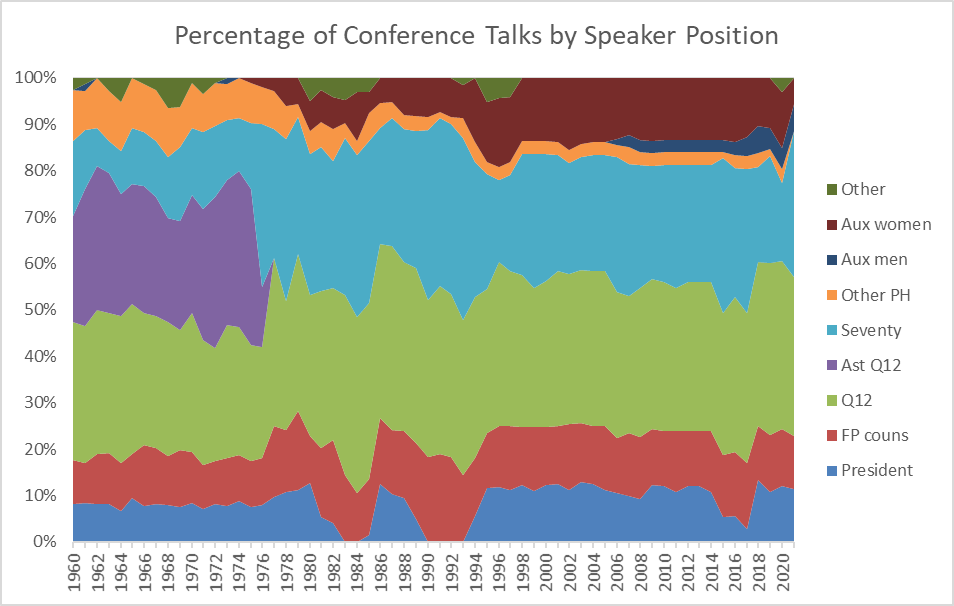
Most of the position categories are pretty straightforward, I think, but I’ll clarify a few that might not be obvious. “Ast Q12” are Assistants to the Quorum of the Twelve, a position that was discontinued in the mid-1970s, and all holders of the position were moved to the Seventies. “Other PH” includes the Presiding Bishopric and the Church Patriarch, back before that position was discontinued too. “Other” includes the occasional member-on-the-street asked to speak (actually a regular occurrence for a few YM in the Priesthood Session for a few years in the 1960s, and then for a few YW in the YW Session for a few years in the 1990s) as well as Mormon celebrities (for example, Don Lind the astronaut, LaVell Edwards the BYU football coach) and holders of important Church positions that aren’t GAs or General Officers (for example, Dallin H. Oaks and Jeffrey R. Holland each gave a talk while president of BYU).
You can see down at the bottom the times when the Church President stopped giving talks because of his ill health. This happened to Spencer W. Kimball in the 1980s, Ezra Taft Benson in the 1980s and 90s, and Thomas S. Monson more recently (although he only missed a single Conference–October 2017–so my averaging the data across the year means the blue area doesn’t fall quite to zero). David O. McKay, by contrast, although he was often in ill health in his later years, continued to give talks up to the end by having his sons deliver them on his behalf.
Another interesting pattern is that the Seventies (aqua colored) absorbed the Assistants to the Twelve, but afterward, the Seventies haven’t done quite as much of the speaking as the sum of the two groups when they were separate. Also, near the top, it’s interesting that the auxiliary women presidencies (dark red) have given markedly more talks than the auxiliary men presidencies (dark blue). This is because there are more women presidencies among auxiliaries (Relief Society, Young Women, and Primary) than men (Sunday School, Young Men), and also because the sessions for men and YM only have always been dominated by the Q15, where for the women’s session, the Q15 only started dominating them recently, after they were made official Conference sessions.
The stacked area graph above is handy in that it shows how all the percentages add up to 100 at each time, but for all groups other than the bottom one, it can be difficult to track whether their area is increasing or decreasing over time if the changes are small. This next graph shows the same underlying data, but in the form of a line graph to make the changes over time easier to see. I’ve also shown only a few position categories of greatest interest to make it easier to look at. Finally, because there’s a lot of up-and-down noise, I’ve added ten-year moving average lines to smooth the trends out.
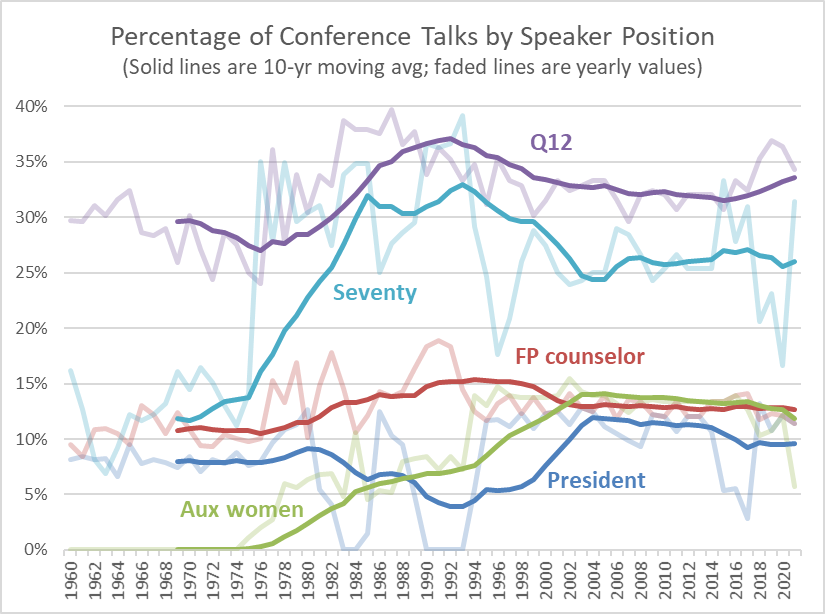
The patterns from the previous graph that I noted are still here, although smoothed out by the moving average lines. The Seventies got a big bump in the 1970s (naturally!) when they absorbed the Assistants to the Twelve. But after that, their share of all talks fell from over 30% to just over 25% in recent decades. The Church President had some dips when the man holding the position didn’t give talks for a while. The auxiliary women increased from zero in the 1970s to almost 15% more recently.
Not apparent in the previous graph, the Q12 have to me what looks like a surprising amount of variability. They increased from below 30% in the 1970s to over 35% in the 1980s, and then fell back down to stabilize at about 30% in recent decades. Given the timing of the increase, it looks like they maybe absorbed some of the talk-giving that vanished when the Assistants to the Twelve went away.
One last thing I wanted to look at is how many different speakers gave at least one talk in a Conference, or across a group of Conferences. I noticed while entering the 1960s talks that it was the same set of speakers from Conference to Conference, with very few additions or subtractions. It makes sense given that Seventies at the time couldn’t age out of their callings like they do now, and it appears that Assistants to the Twelve were also called for life. Unless someone died, there just wasn’t much change in the group of men giving talks.
This last graph shows the number of different speakers who gave at least one talk in a year (like in the previous graphs, I’m aggregating the April and October Conferences in each year), as well as in the previous two years, five years, and ten years.
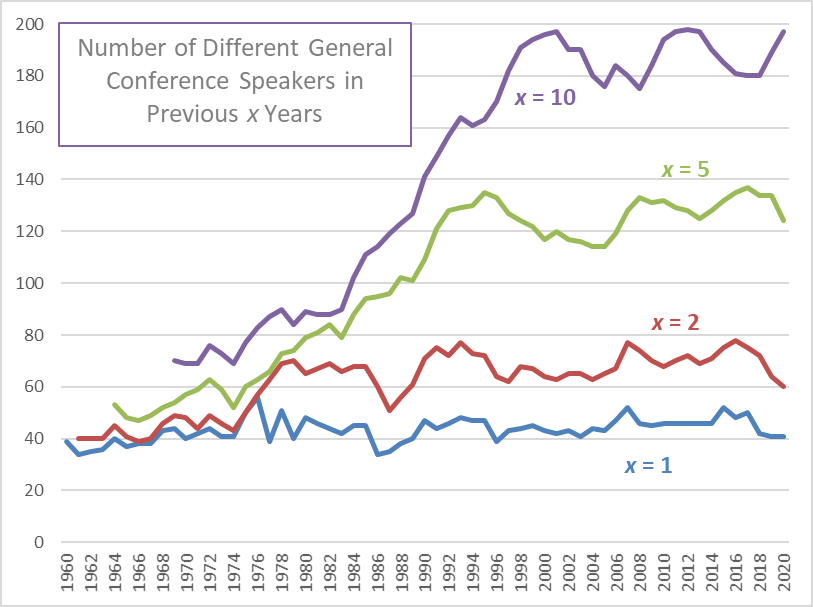
You can see the pattern I was describing. In 1969, the number of different speakers across the past ten years was only 70, where a single year typically had about 40 different speakers. So only a few new speakers were added each year. Since the late 1990s, each ten years of Conferences includes more than twice as many different speakers, even as the number of different speakers in each year (the blue line) has only edged up slightly. This happens because we have far more Conference speakers now who have time-limited callings, so other than the Q15, there’s a rotating cast of speakers who come and go every few years.
The biggest change across this time period has been for the Seventies. In the 1960s, there were just the seven men serving in the First Council of the Seventy. There were few enough of them that most of them spoke most Conferences. For example, Bruce R. McConkie was a Seventy through all through that decade. In the 20 Conferences, he gave 15 talks. Of course, such a thing would be unheard of now. Since the Assistants to the Twelve were merged with the Seventies to make the First Quorum of the Seventy, and far more Seventies have been called, there have been more different men available to fill the relatively fixed number of speaking slots. Now Seventies get to speak only every few years (generally following a pattern) rather than most Conferences.
Getting back to my original motivation for wanting to look at this data, I wonder if the Seventies aren’t an obvious place where speaking frequency or criteria couldn’t be tweaked if the GAs saw fit to assign more slots to women. One possibility would be to just take a slot or two from the Seventies (there are typically 7-11 talks from Seventies in recent Conferences) and assign them to women. The Seventies would all be bumped back and speak only every four years where they had been speaking every three, or whatever the typical frequency is. Another possibility would be to just reconsider the whole idea of having all Seventies speak in Conference at all. Perhaps there are just too many for that to be manageable now, and maybe we could have only the Presidents of the Seventy speak. They’re a much smaller group, like the First Council of Seventy was in the 1960s. Unlike that group, though, the current Presidents rotate in and out, so we would still get to hear from a varying group of speakers from one Conference to the next.
I’m curious to see what happens in October, if we get the two women speaking that I fear or if there will be more, and if there are more, from what other group of speakers the slots will be taken.
1 comment
Comments are closed.