Note: In the original version of this post, I had Elders Gong and Soares out of order at the bottom of the graph. Thanks to Jim, who commented on the previous post to point out the problem, I’ve now fixed it.
While I was working on my last post about each Q15 member’s probability of becoming Church President, I realized that I could look at the question a different way. Rather than calculating probability, I could work out how long each member would have to live in order to outlive everyone senior to him. For those much younger than those senior to them, this will be a relatively young age; for those close in age or perhaps even older than those senior to them, this will be a greater age. I know probability answers the question of who’s likely to make the top spot more directly, but I like the vividness of the how long would he have to live question.
Using the same method I used in the last post (see the Method section below for details), I calculated the life expectancy for each current Q15 member from the SOA mortality table I’ve been using. Then it was straightforward to also find, for each member, the longest remaining life expectancy of any other member senior to him, and from that, the age he would have to reach to become Church President.
I thought it would also be fun to look at needed life expectancy to become Church President for past Q15 members. This is even easier to calculate, as everyone’s lifespan is already known, so there are no life expectancy calculations required. For each member, I just noted the latest death date of anyone senior to him, and subtracted the member’s birthday to get the age he needed to reach to become Church President.
The graph below shows life expectancy needed to reach the presidency for all Q15 members back to Heber J. Grant. It’s a little busy, so let me walk you through what’s in it.
- Fatter bars with lighter shading show needed life expectancy to become Church President.
- Skinnier bars with darker shading show actual lifespan (or current age for living members).
- Outlined white bars tacked on the skinny bars for living members show remaining life expectancy.
- Gray and black bars give actual, known values.
- Blue bars are based on at least some life expectancy estimation.
- Note that the graph cuts off the ages 0 to 20 to focus better on the ages where there are differences.
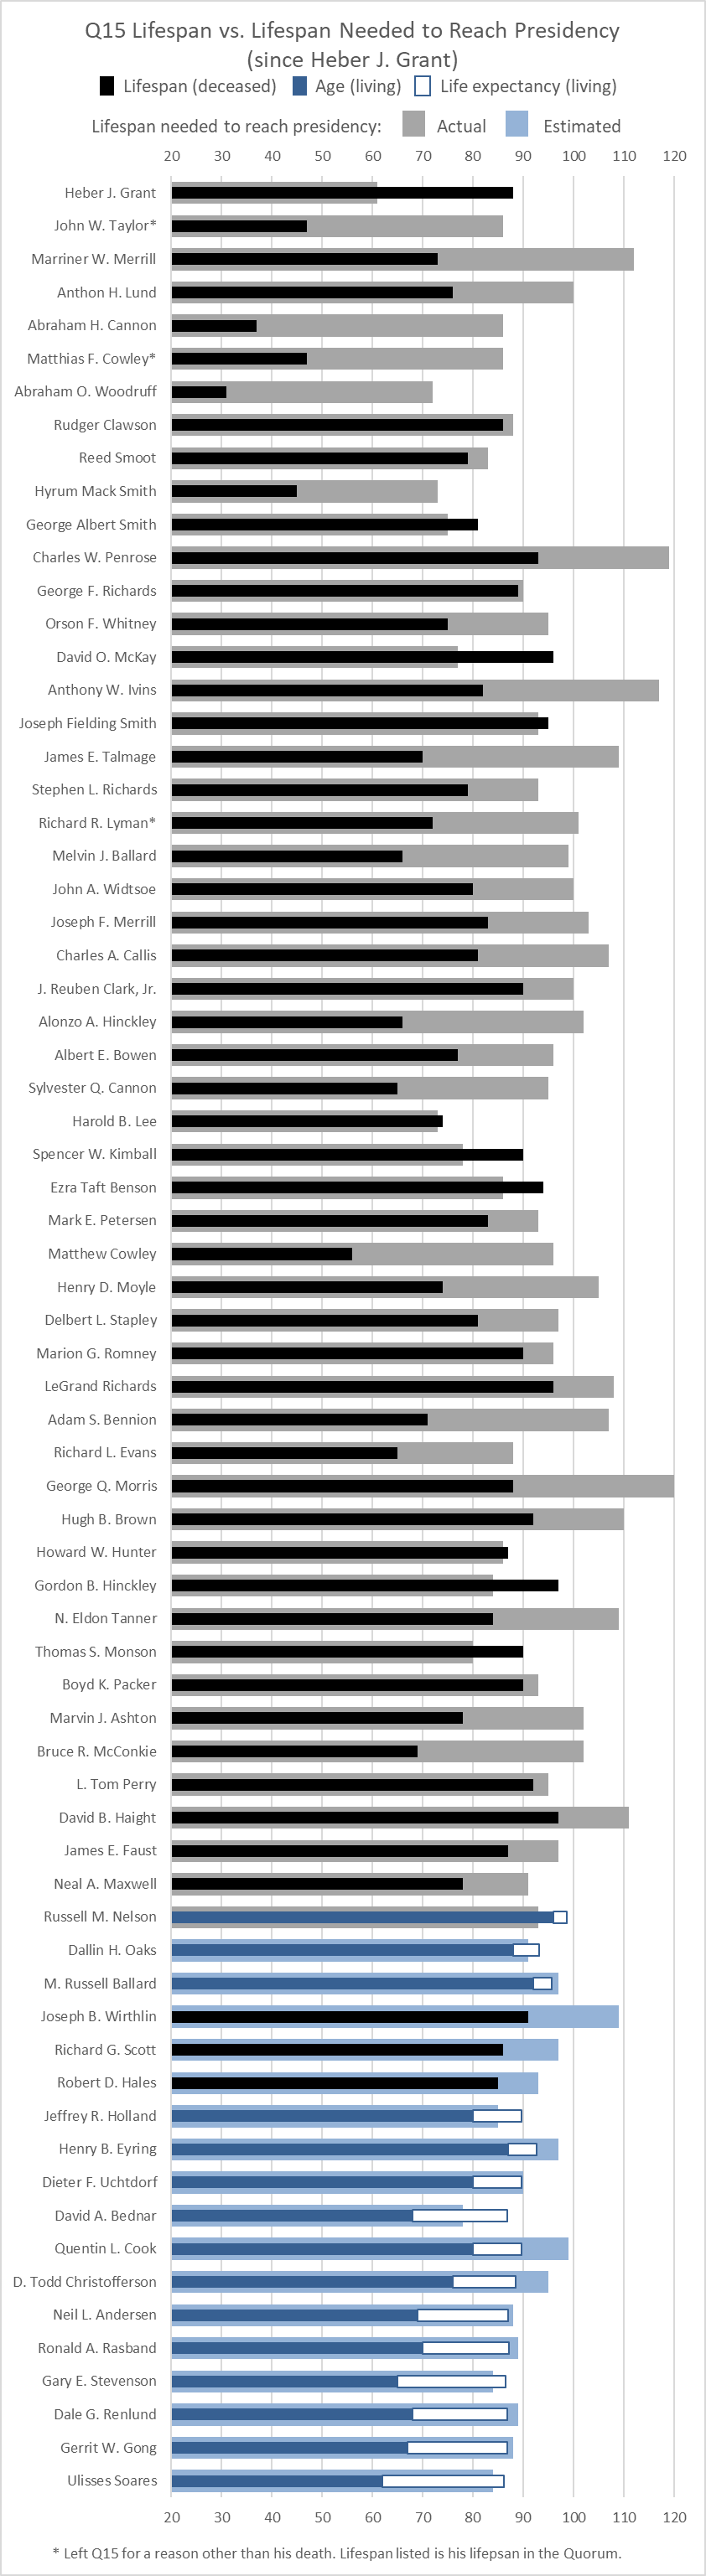
One thing to note is that a few members have one blue and one black bar. For President Nelson, the age needed to become Church President is known, not estimated, so his fat bar is black, but his actual lifespan is still unknown, so it’s blue. For Elders Wirthlin, Scott, and Hales, the reverse is true, as their lifespan is known, so their skinny bar is black, but the age they would have need to have reached to become Church President is still increasing, as there are three men senior to all of them still living, so their fat bars are blue.
There is a lot of variability in how long different Q15 members would have had to live to become Church President. For some, it’s a really long time; for example, Charles W. Penrose (119), Anthony W. Ivins (117), and George Q. Morris (120) would have had to be among the longest-lived people ever on record. Closer to the present, David B. Haight would need to have reached 111, and Joseph B. Wirthlin would have had to live to at least 109. (His age needed is still going up, as Presidents Nelson, Oaks, and Ballard are all senior to him.) At the other end of the spectrum, Heber J. Grant outlived everyone senior to him by age 61. Abraham O. Woodruff died at 31, but had he made it to 72, he would have been Church President like his father. Harold B. Lee only needed to make it to age 73. David A. Bednar is predicted to need to live to age 78 to reach the top spot.
It’s also interesting to look at the closest misses. Joseph Fielding Smith, Harold B. Lee, and Howard W. Hunter are of course known for just barely making it to the presidency, before dying shortly thereafter. But who was closest to making it without actually getting there? George F. Richards needed to live to age 90 to be Church President; he died at age 89. Closer to the present, Boyd K. Packer (needed 93, lived to 90) and L. Tom Perry (needed 95, lived to 92) are the closest misses.
It’s probably the living Q15 who are of most interest. By this method of assigning each man his life expectancy, President Oaks will be President, as well as Elders Holland, Bednar, Stevenson, and Soares. Elder Andersen is a close miss (needs 88, expectancy is 87) and Elder Uchtdorf is a very close miss (needs 90.1, expectancy is 89.6).
One last point: It might not be immediately obvious, but the fat bars that show age needed to become Church President are noticeably less variable in length for living Q15 members than for deceased ones. For example, compare the 17 Q15 members for whom the age needed to become President is still unknown (i.e., the ones at the bottom with blue fat bars) against the previous 17 for whom the age needed is known (LeGrand Richards through Russell M. Nelson). The range of values for the unknown required age group is 31 (from 78 to 109), but for the known required age group, it’s 40 (80 to 120). The standard deviation (a measure of how spread out the values are) for the unknown required age group is 7.2, but for the known age group, it’s 11.2. This is important to note because the difference shows that although assigning life expectancy to each man to do these calculations is good as a best guess, it’s almost certain to be wrong in that some members will overshoot or undershoot their life expectancies, perhaps dramatically. We just don’t know which ones.
If you’re interested, continue reading for the method of calculating life expectancies. I promise that it’s less complicated than last time! But I’ll understand if you want to stop here.
Method
I outlined how I calculated life expectancy from the mortality table in my last post, but it was more complicated in that case because I did it in the context of finding an adjustment factor. Here it’s simpler, so I’ll just briefly explain again.
The calculation is done separately for each Q15 member, because they’re each starting from a different age. The table below shows an example for President Nelson, so you can see it starts with age 96. All prior ages can be ignored, because of course we already know he didn’t die at age 95 or 94, etc. The second column gives probabilities from the SOA mortality table. These tell the probability of dying in the next year given current age. 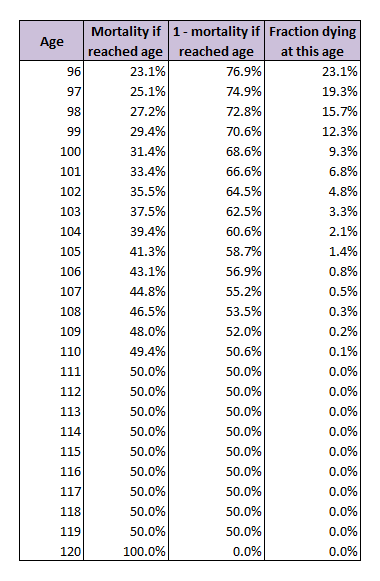
The third column is just one minus the second column, or the probability of surviving another year given living to the age in the first column. In the last column, I calculate the fraction of 96-year-olds who are expected to die at each age. For age 96, this is just the mortality probability in the second column: 23.1%. For each subsequent age, though, I have to take into account that not all 96-year-olds would even survive to this age. For example, for age 97, the mortality probability is 25.1% (second column), but only 76.9% of 96-year-olds will make it to age 97 to begin with. So the fraction of 96-year-olds expected to die at age 97 is the product of the two values: 76.9% × 25.1% = 19.3% of 96-year-olds are expected to die at age 97. For later ages, the calculation works the same. To get the fraction of 96-year-olds surviving to the start of the year, I just take the product of the survival probabilities from all previous years. For example, for age 100, the fraction of 96-year-olds expected to die at that age is 31.4% (the mortality table probability) × 76.9% × 74.9% × 72.8% × 70.6% (survival probabilities for all previous ages) = 9.3%.
Once the last column is worked out, the life expectancy can be worked out as the weighted average of the ages, with the fractions from the last column used as weights. From this table, it’s 96 × 23.1% + 97 × 19.3% + . . . + 120 × 0.0%. (Ordinarily when calculating a weighted average, I would have to divide by the sum of the weights at the end, but here the sum of the fractions in the last column is 100% or one, so the division would have no effect.) The result is a life expectancy of 99, or three more years, for President Nelson.
Have you seen Hans Rowling’s 200 countries, 200 years, 4 min YouTube video? It’s an interesting overlay to our church’s 200 years, and the data you are showing here. I’m struck at the gerontocracy and how old our Q15 become. They’ve led privileged lives that span essentially a century. In contrast, the blue-collar Utah-born males in my family have died in their 60’s. (Following the WoW, being born into similar and even related lines.) I know that’s an anecdotal fact that is statistically irrelevant. But I can’t help but wonder how their lifespans would differ if we had plow-boy prophets, or carpenters, or other blue collar Q15 again.
I haven’t seen it. Thanks for the recommendation. And that’s a great point about the Q15 being such a white collar group!
https://youtu.be/jbkSRLYSojo
A friend pointed this to me because I made a post on social media about how tenure in Q15 has been trending downward even as life expectancy has increased. But they don’t offset each other fully. Looking at quarter-century cohorts, the average age at time of calling has doubled since the early church (from 31 to 62 years) but the tenure has declined from 35 years* for those called before 1850 to 25 years for those called between 1976 and 2000 (although even with smoothing by quarter centuries, the data shows a very messy picture). For the latter cohort I considered only those who are already deceased, so I did understate the average tenure somewhat.
* This figure represents what the tenure would have been had all Q15 members served their full lifetime tenure. If you factor in all of the excommunications it drops to 24 years.
If someone were called today in the 30s, as in the early church, we could conceivably end up with someone serving for a very long term as church president.
That makes sense, Karl. I do wonder if today’s GAs (or those of the 1960s) had a sense of what it meant when they called men like Thomas S. Monson or David A. Bednar at such young ages relative to their peers. If they think in terms of probabilities, I would think they must consider that they’re giving them a high probability of running the Church, and for a relatively long time. But I kind of suspect they don’t, and that they figure God had a predetermined order and age the men will die at, so it doesn’t matter how old they are when they’re called.