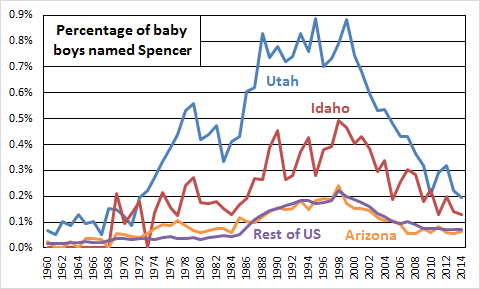
In my last post, I looked at how often children in Utah, Idaho, and Arizona are named after the current Church President. I thought it also might be interesting to look at how often children are named after people in the Book of Mormon. One advantage of looking at Book of Mormon names is that it doesn’t require me to limit myself to states with lots of Mormons. If you’re naming your child Nephi, you’re probably Mormon, regardless of where you live. The downside, of course, is that this rules out names that are not unique to the Book of Mormon. For example, someone naming their child Benjamin may be thinking of the Book of Mormon king, but there are many other Benjamins out there that their choice was more likely inspired by.
Because using a Book of Mormon name is a clear marker of Mormonness, there’s even good reason to have a hypothesis beforehand about what the data will look like. In The Angel and the Beehive, Armand Mauss talks about the Church’s shift between the 1960s and 1990s from leaning toward assimilation with the broader world, toward more retrenchment. I think it would make sense to expect that Mormons would use more distinctly Mormon names during a period of retrenchment, when drawing bright lines between the Church and the world is an important practice, than during a period of assimilation. Therefore, I expected to see increasing usage of Book of Mormon names between the 1960s and 1990s.
I got data from the same sources as I did for my last post: the Social Security Administration (SSA) name database for counts of how often names are used by state and year from 1960 to 2014, and CDC Vital Statistics reports for counts of total births by state and year for the same time period. Here is an alphabetical list of the Book of Mormon names I checked:
Abinadi, Abish, Helaman, Jarom, Lehi, Limhi, Mahonri, Mormon, Moroni, Mosiah, Nephi, Omni, Sariah, Teancum, Zeniff
I looked at the girls’ names first: Abish and Sariah. Unfortunately, Abish only shows up in three of the years (1999, 2000, and 2003). The SSA database doesn’t report counts of less than five (for either a state or the entire country), so it’s likely that the name was used in other years, but just fewer than five times. For Sariah, I ran into a different problem. I thought it was a uniquely Book of Mormon name, but while the SSA data shows elevated levels of usage in Utah, Idaho, and Arizona, the name also appears in lots of other states. Overall, Utah, Idaho, and Arizona account for only 11% of uses of the name. I wonder if it isn’t being used by people not referring to the Book of Mormon as an alternative spelling of Saria or another takeoff on Sara(h). In any case, given that the name doesn’t appear to be an indicator of Mormonness, I put it in the non-unique bin with names like Benjamin.
For three of the boys’ names, I found no hits at all: Limhi, Mormon, and Zeniff. Because of the reporting threshold of five, this doesn’t mean these names are never used, but if they are, it’s clearly very rare.
The remainder of my analysis looks at just the remaining ten names. Here’s a graph showing how often they are used in the full US data.
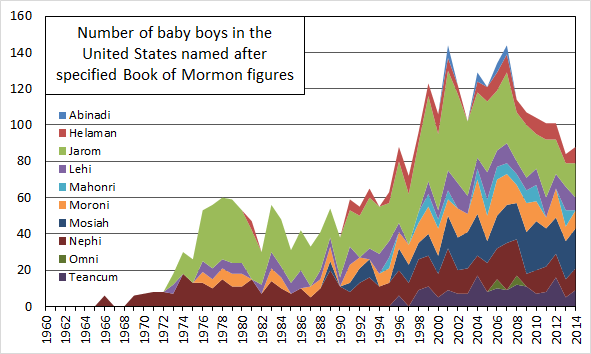 To me, the big surprise here is Jarom. I would never have guessed that it would be used most among the list of names I started with. I included it kind of as an afterthought, since he’s such a minor character.