Right before the turn of the millennium, President Hinckley rolled out a new temple-building campaign that reimagined what a temple could be. The Church began building temples that were far smaller than their predecessors, but were also much closer to where members lived.
It has been a couple of decades since then, and President Nelson has his own slew of newly-announced temples. I don’t think he’s made an explicit point like President Hinckley did, of saying they’ll be smaller. I think the sizes are clearly varying by location.
I got to wondering how much of the temple capacity of the Church is still in Utah, or still in the US. My impression is that even with many of the small Hinckley-era temples being built in the US, there are still often quite large temples built here, even in the Mormon corridor. Look at Payson, Utah (dedicated in 2015), for example, or Gilbert, Arizona (dedicated in 2014).
To answer my question, I looked on the Church website at how many endowment sessions there were in each open temple, and how many seats were available in those sessions, for two dates in February: the 14th and the 25th. I checked the number of available seats at least a month before the session dates so that few would be likely to be scheduled. I chose these date to have one weekday and one Saturday, and to not be right next to each other, so a temple that might be closed for cleaning on one day, for example, might open back up on the other. Also, I chose to look at endowment sessions because they’re by far the most time-intensive of vicarious ordinances, so they’re the biggest potential bottleneck.
There are 161 temples with at least one endowment session on February 14th or 25th. (I did notice that a few temples that weren’t listed as having sessions available when I started gathering data did when I checked back in the last few days, so it’s possible that a few more will open between now and then so I may be undercounting a little.) Here’s a breakdown by region.
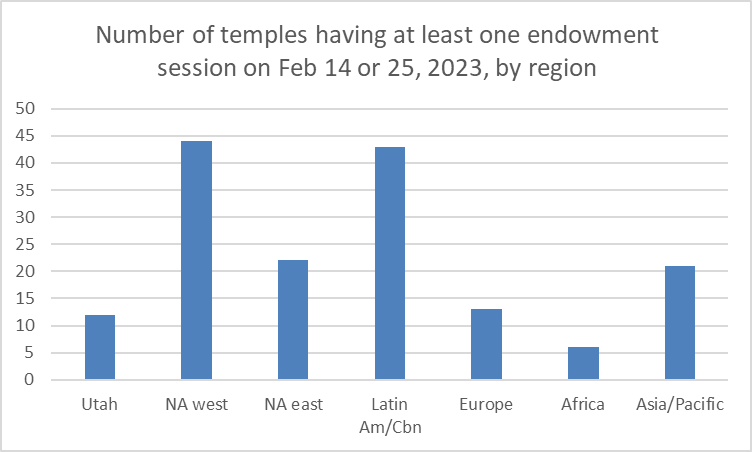
Hopefully the regions I used are intuitive. Utah you can probably guess. NA west and NA east are the US and Canada split at the Mississippi River. (I had to estimate where it would go into Canada; I put Winnipeg in the west.) Latin American and the Caribbean are the rest of the Western Hemisphere south of the US/Mexico border. Europe, Africa, and Asia/Pacific are probably straightforward.
Anyway, North America west and Latin America/Caribbean both have over 40 temples. Asia/Pacific has 20. Utah has only 12. But what if we count sessions instead of temples?

North America west maintains its standing, Utah surges up to second place, and the rest of the regions shrink relatively. How about number of seats in those sessions?
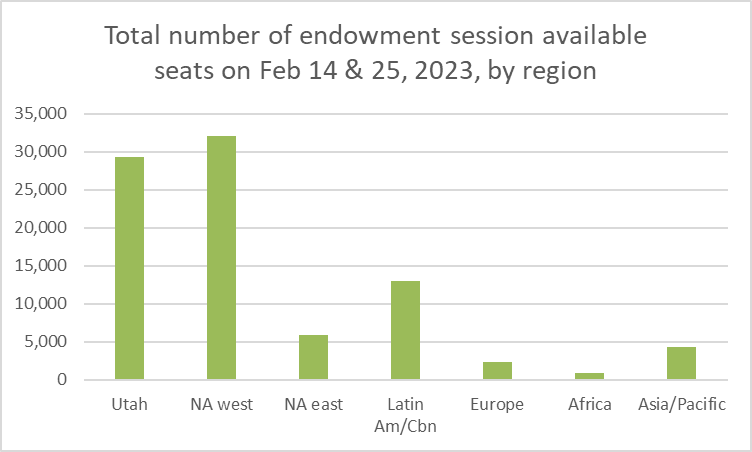
Now Utah, with about 31,000 seats, nearly catches up with North America west, with over 34,000. Latin America/Caribbean has almost 13,000, and all the other regions have fewer than 10,000. (Note again that this is available seats at the time I checked. The total number of seats including those already scheduled, is higher, although when I estimated it–see the last graph in this post–it didn’t change the story much.) Utah’s temples tend to have a lot of endowment sessions, and those sessions tend to have a lot of seats. These next three graphs make that explicit. First, here’s the number of sessions per temple summed across the two days.
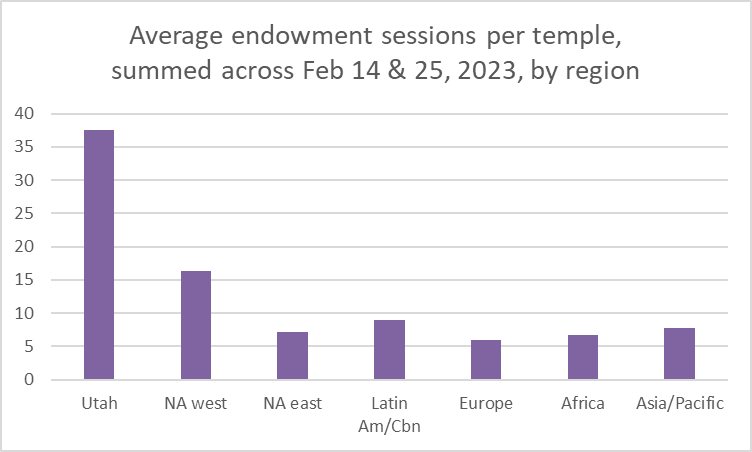
Because it’s two days of data added up, we’d have to divide by two to get the number of sessions per temple per day, but still, Utah temples average over 18 sessions per day. No other region is even close.
This next graph shows seats per session.
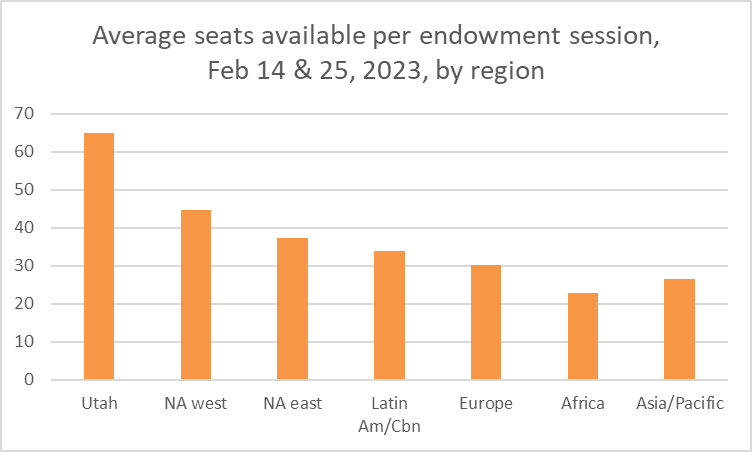
Utah leads here, with 65 seats per session, although the lead isn’t nearly as large as it is for sessions per day. This next graph combines the two measures above by multiplying them, to yield seats available per temple across the two days.
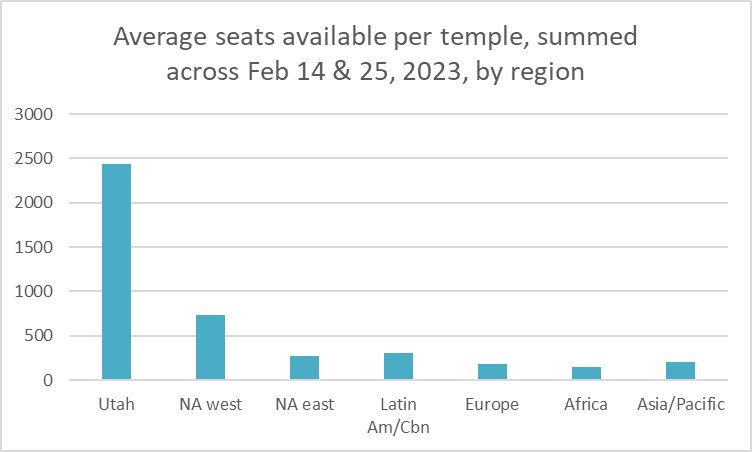
Again, as it’s two days of data, we can divide by two to get the seats per temple per day. (Note that this dividing wasn’t necessary for the previous graph because it’s already seats per session, so divided by number of sessions.) Utah has over 2400 seats per temple across the two days, so over 1200 per temple per day. No other region is anywhere close. North America west has over 700, so over 350 per temple per day. At the low end, Asia/Pacific is at about 200, Europe at about 175, and Africa at about 150 (and again, divide these by two to get seats per temple per day).
This last graph puts everything together by converting the number of temples, number of sessions, and number of seats all into percentages of the total for the world.
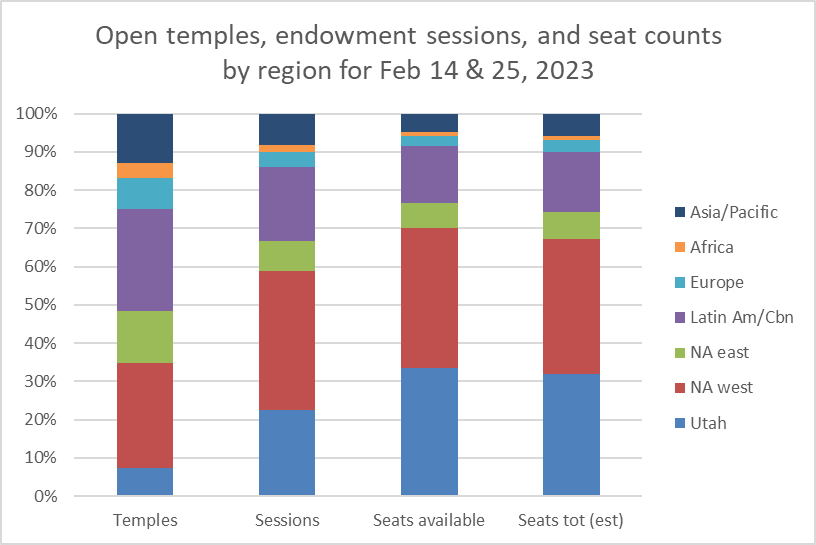
The first column shows a breakdown of temples, the second of sessions, and the third of available seats. In the fourth column, I went back and tried to estimate how many seats a session might have originally had before any were scheduled. (This was typically pretty straightforward, as sessions in the same temple typically start with the same number of seats, so I could just look at other sessions from the same temple to work out the starting number. I estimated the total number of seats was about 12% more than the available number, but as you can see from the similarity of the available seats column and the estimated total seats column, this didn’t make much of a difference in the breakdown by region. This is why I just used the available seats numbers throughout this post.)
You can see how Utah has fewer than 10% of the temples, but over 20% of the sessions, and over 30% of the seats. Seats per session are presumably a straightforward function of the size of the endowment rooms, and sessions per day are a function (less straightforward, but a function still) of temple size, as more endowment rooms means more opportunity to have multiple sessions going at one time, and therefore more possible sessions. Anyway, the bottom line is that even as temple access trickles out across the world, the big temples in the west of North America and Utah in particular still mean that there is far more temple access there than anywhere else. It will be interesting to see how this might evolve as President Nelson’s spree of announcing temples comes to fruition.
You need one more chart: membership by area. (Well, active membership would be a better chart, but good luck getting those numbers.) I took a list of the 20 countries with the most members (https://newsroom.churchofjesuschrist.org/article/what-are-the-countries-with-the-most-latter-day-saints) and sorted those. It still leaves 7% of church membership without a home. Given that most of North and South America are already covered, this is probably undercounting Europe, Africa and Asia/Pacific. I substracted the UT membership (https://newsroom.churchofjesuschrist.org/facts-and-statistics/state/utah) from the USA membership, but didn’t have the patience to look up every state and Canadian province to get a NA-East vs NA-West split. Anyway, here are my results:
Utah – 2.16M – 13.0%
NA (excluding UT) – 4.76M – 28.6%
Latin Am – 6.49M – 38.9%
Asia/Pacific – 1.44M – 8.7%
Africa – 0.419M – 2.5%
Europe – 0.188M – 1.1%
Unidentified – 1.21M – 7.2%
It makes sense that places with high LDS density (Utah, Idaho, AZ, etc.) would have fewer, larger temples. But it seems that with 30% of the seating capacity, UT is greatly over-templed, as is North America in general. Latin America seems to be greatly under-templed. I suspect that numbers for active or recommend-holding members would line up at least somewhat closer to the temple capacity charts you’ve made.
Great addition, DaveW. I wonder, though, whether Utah and North America would still show an excess of temple capacity even with counts of temple recommend holders, as the building of temples seems like it lags the growth of the Church in a particular region.
You analyzed “available seats” by looking at capacity a month or so in advance. Now I wonder if it would be possible to look at utilization, by looking at seats available on the day of. (I guess maybe that would under-count actual attendance, since walk-ins without appointments could fill up empty seats.) But a utilization of available seats seems to me as interesting (in a different way) as availability of seats. It’s seen as a sign of progress that new temples are being built, but are there sessions that are nearly empty? I remember back when I lived in Maryland two decades ago, there were some sessions at the WDC temple during the day that would get canceled because there weren’t enough patrons to fill the session. And that was when the nearest other temple was in Atlanta. I wonder if growth of membership in the DC area has compensated for the shedding of much of the territory that used to belong to the DC temple district to the many other temples that have been built in that region.
Similarly, I wondered recently about the new Anchorage Temple, which is going to be built three-times bigger than the existing temple (which was one of the first original Hinckley mini-temples). It would be interesting (to me, anyway) to know how many seats go unclaimed now, if any, and whether there have been long lines or long waiting lists that led to the planned demolition of a relatively new temple and its replacement with a much bigger one.
I definitely agree, Mark D. If I have the energy, I’m hoping to put something together on utilization too for a future post.
I’m a little confused about a couple of things. By “available seats,” are you counting just the seats that haven’t been reserved? So a fully reserved session would have zero available seats? Wouldn’t that be largely a function of the time until the scheduled session? For example, I would expect quite a few seats would be reserved for this coming Saturday, while a session in a couple weeks or in a few months would be unlikely to already have reservations. People tend not to plan their temple visits that far out. Maybe I’m unclear about what questions you are addressing with that information. The actual temple capacity would be a function of the number of sessions and the number of seats, not how many seats have been reserved in advance. Perhaps the actual number of seats can be determined from photographs.
Ziff, I think the further members have to travel to a temple the more likely they are to book sessions well in advance, particularly if they are also booking overnight accommodation. That’s certainly true here in Britain where both temples have accommodation centres.
I wonder how many people are employed by the church in Utah and NA West and whether that’s a relevant factor if temple attendance is compulsory (explicitly or socially) for that population. I’m vaguely recalling faculty at BYU-I who attended weekly whether they wanted to or not.
Left Field, yes, the scheduling tool on the Church website only lists available seats, not total seats for the session. That’s why I looked when the dates were at least a month in the future, so hopefully few would be taken. It’s also why I did the analysis shown in the rightmost bar in the last graph, to see if it mattered if I tried to estimate the total number of seats for the session (by looking even further out in the future, or looking at adjacent sessions–if the counts are 60, 60, 60, 60, 58, and 60 for a series of sessions, it’s a good bet that that 58 was originally 60). I like the idea of using photos to count seats, but unfortunately from what I’ve seen, it looks like there are times when temples artificially limit the number of seats for a session, so room capacity might not be the last word.
Hedgehog, that’s a great point I hadn’t thought of. I’m interested to look at utilization like Mark D suggested, but I worry that any differences might be obscured by differences in people’s willingness to use the scheduling system at all, as you point out. If you’re going to the Jordan River Temple, for example, you can probably still just plan on dropping in and finding an open seat, but this is probably less true in most of the world.
Beelee, that’s a fascinating point! I had no idea there were places where people were *required* to go to the temple. I guess with employees, the Church has even extra leverage. I’ve definitely lived in places where we were prodded to have frequent ward temple trips, but there’s never been even the whiff of requiring it.
My temple in Louisiana has 9 stakes in the temple district. I checked Jordan River, and counted 67 stakes in the temple district. Utah and the western US have a lot more temple capacity, but they also have a lot more stakes (and church members) for each temple. I suspect if we calculated the number of seats per stake/district assigned to each temple, the number of seats per stake might actually be less in Utah and the west, compared with other regions.
This is great analysis. I did a different but related analysis last year of temple construction costs (https://qhspencer.github.io/lds-data-analysis/temples/), which led me to look at temple square footage per member. I only analyzed the whole membership of the church and not regional membership, but one notable thing I discovered is that all of the newly announced temples will take us into a new era of fewer members per square foot of temple space that hasn’t been this low since around 1970 when some of the historic temples hadn’t yet converted to filmed endowments.
Wikipedia lists 54 temples under construction or with groundbreaking scheduled, and has size estimates for most of them. (https://en.wikipedia.org/wiki/List_of_temples_of_the_Church_of_Jesus_Christ_of_Latter-day_Saints#Under_construction)
UT – 10 temples – 19% of temples – 43% of square footage
NA West – 10 temples – 19% – 15% of sq ft
NA East – 3 temples – 6% – 5% of sq ft
Latin Amer – 14 temples – 26% – 18% of sq ft
Asia/Pacific – 12 temples – 22% – 14% of sq ft
Africa – 5 temples – 9% – 5% of sq ft
Europe – big fat zero.
7 of the temples (in Africa, Asia/Pacific and Latin Amer) did not have a square footage listed, so I plugged in 20,000, which was near the average size for those areas. All areas have an average temple size of 19k-29k sq ft, except for Utah, where the average under construction temple is 77,000 sq ft. By the looks of it, in the near term Utah will be even more highly-templed.
Looking further out on the timeline, there are 68 announced temples, which have a very different breakdown. Many do not have square footage listed, so I haven’t bothered with that.
UT – 0 temples – 0%
NA West – 12 – 18%
NA East – 5 – 7%
Latin Amer – 22 – 32%
Asia/Pacific – 12 – 18%
Africa – 10 – 15%
Europe – 7 – 10%
Thanks for the pointer to your analysis, Quentin! Fascinating work! I especially like your members per square foot of temple calculation and also your construction cost estimates.
DaveW, thanks for filling out on future temples! And if you haven’t already seen it, I think you’ll really enjoy Quentin’s post linked in the comment above yours.