I’ve seen the possibility floated in a number of places (e.g., in this W&T post) that when the Church resumes regular Sunday meetings, fewer people will go back than were attending regularly before the pandemic. I can certainly see the argument for this. It’s much easier to continuously keep up with a practice like weekly church attendance than to stop and start, particularly if there were already barriers making attendance difficult (distance, hearing offensive things, etc.).
I was wondering if there’s any way to forecast the degree to which this might happen by looking at what people are doing now, while not attending church. Of course this is an extremely difficult thing to measure. Not even individual wards, which typically have at least some sense of activity level from sacrament meeting attendance if nothing else, likely have much idea of what’s going on. But Google does. Google Trends tracks what people are searching for online. While this is obviously far from a perfect measure of how engage people still are with church while not attending, it might give us at least a little insight.
There are a few important things to know about Google Trends data:
- You can get results by countries, states/provinces, and even metro areas. I wasn’t interested in geographic differences here, so everything I’ll show comes from worldwide results.
- It doesn’t give absolute numbers–like the number of people who searched for something–but rather relative search numbers, comparing across search terms or across time for a single search term. It always gives results normed so the highest value is 100.
- It lets you search for words (literal searches people have performed) or topics, where related searches about the same thing are aggregated. I chose to search for the topic “Church of Jesus Christ of Latter-day Saints,” because I suspect Google is smart enough to aggregate searches like “Mormon church” and “LDS church,” and also because their help says that topics aggregate across languages. I also tried a few other LDS topics, but they gave a far smaller search volume, so for this analysis, I just stuck to that single topic.
- You can get results back to 2004 and up to a few days ago. The granularity of the data you get depends on how long a time frame you ask for. If it’s short enough, you get daily data. If it’s longer, you get weekly or monthly. I wanted daily data from January 2019. This is a long enough period that if I asked for it all at once, I got weekly data. My solution was to ask for daily data in a series of three-month periods. Unfortunately, this means that each query for a three-month period was normed to a different maximum value. In order to make the results from the different three-month periods comparable, I set them to overlap a little. By doing this, I got two results for the days that appeared in both periods, and I could use the ratio between the values given for those days in the two periods to re-norm one period so that it was comparable to the other. I used a series of re-norming steps like this to stitch together the entire daily series from January 2019 to May 2020.
The graph below shows relative search volume for the Church for the entire period.
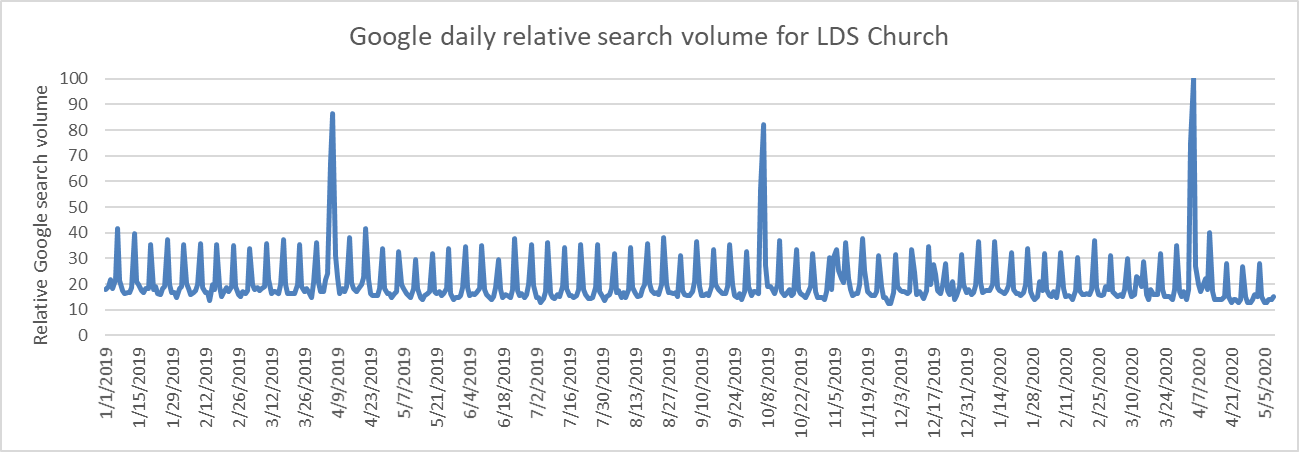
There are two extremely clear patterns: First, there are big spikes at General Conference time. Second, there are weekly spikes every Sunday. Both of these are probably unsurprising.
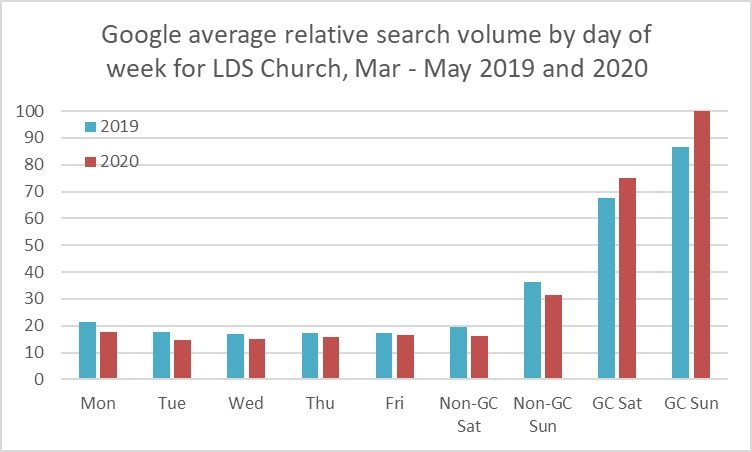
I averaged the values by day of the week, making separate categories for non-Conference versus Conference Saturdays and Sundays. The result is shown in this graph.
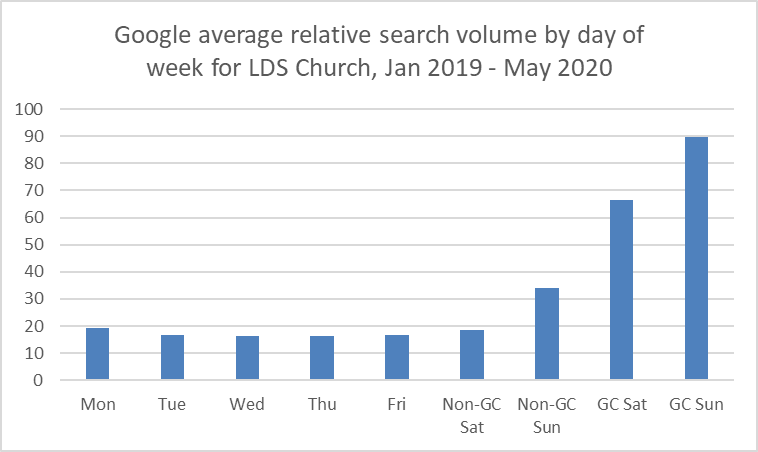
Conference Saturdays and Sundays dwarf all other days. (Note that the highest value isn’t 100 here because it’s an average of three Conference Sunday values, only one of which scores at 100.) Of non-Conference days, the middle of the week has the lowest scores, and there’s hardly any variation by day. Sunday-adjacent days–Monday and Saturday–score a little higher, but it’s really mostly Sundays that stand out, scoring about twice as high as the mid-week lows.
Because the Sunday and Conference trends are so strong, I thought they might be hiding any other possibly interesting wiggles in the data. This next graph is the same as the first one, but it just blanks out Sundays and General Conference days. Note that the vertical axis now only goes up to 40.
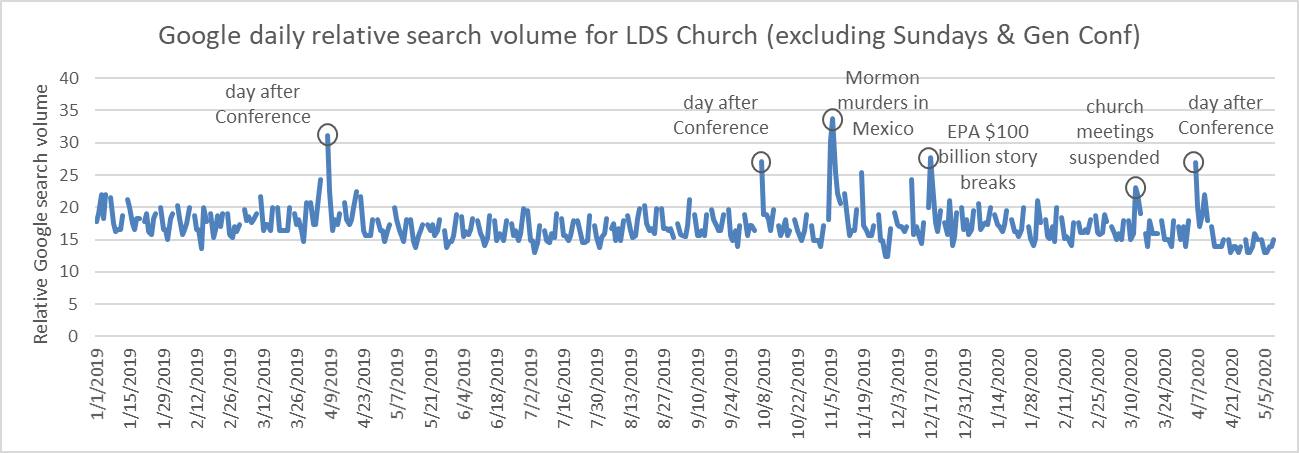
I’ve labeled some of the high points with what I think was the likely cause. Clearly even though Conference always ends on Sunday, there’s a day-after-Conference effect where interest still remains high. There are also spikes for the November 2019 massacre of (non-LDS) Mormon families in Mexico, for the December 2019 story about the Church holding $100 billion in an investment fund, and for the Church’s March 2020 announcement that church meetings would be suspended in response to the pandemic.
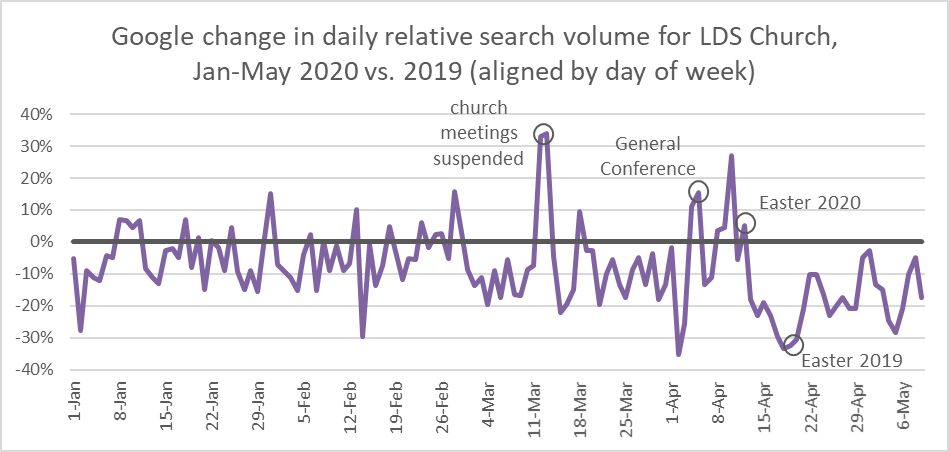
By now I suspect you’re thinking I’ve lost sight of my original purpose with this post, but I was just getting back to it! In this next graph, I’ve lined up daily values from 2020 with corresponding daily values from 2019, so we can see how different (if at all) the 2020 values are. Because the day-of-the-week trend is so strong, I moved the 2019 dates slightly so they would line up by day of the week rather than by day of the month. For example, January 1, 2020, which was a Wednesday, is compared with January 2, 2019, which was also a Wednesday.
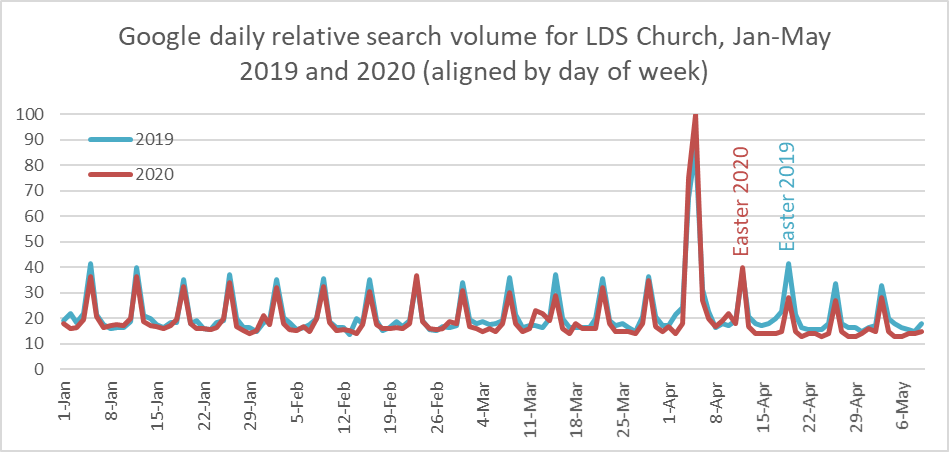
It’s handy that the General Conference weekends line up. This year’s April Conference looks like it drew more interest than last year’s. I suspect this was at least partially attributable to President Nelson’s teaser last October, and perhaps also to curiosity about what Conference would look like with no attendees.
Easter doesn’t line up nicely, though. It was April 12th this year, but April 21st last year. I’ve labeled these in the graph because they explain why 2020 actually has a higher value the Sunday after Conference than 2019, and why 2019 is so much higher than 2019 two Sundays after Conference.
Overall, the 2020 values are noticeably lower than the 2019 values. This is particularly true since the suspension of church meetings in March. But even before that, it looks like 2020 was typically slightly lower.
To make this comparison of 2020 versus 2019 easier to see, in this next graph, I’m showing percent change from 2019 to 2020 for each matched day. For example, January 1, 2020 has a value of 18.07 and January 2, 2019 has a value of 19.09. The percentage change is (18.07 – 19.09) / 19.09 = -0.053 = -5.3%. That -5.3% is the value at the left end of the line in this graph.
Reflecting the previous graph, the majority of the changes are negative, even before March. But starting with March 12-13, when values were much higher for this year because of the announcement on March 12, they’re almost entirely negative. The exceptions are for General Conference, for Easter and a couple of days before it, and for March 18, which I don’t have an explanation for. During the pandemic, interest in church is clearly down compared to last year. This is probably no surprise, but it’s always interesting to confirm even obvious suspicions with data.
Like I said at the beginning, this measure is obviously a flawed one for getting at people’s interest in the Church, or their future interest in or engagement with church. It does suggest, though, that the Church might be less on people’s minds during the pandemic than it had been before. It remains to be seen whether this will translate into less participation when the Church starts having regular Sunday meetings again. I suspect that it probably will, at least somewhat.
One last comparison I thought would be interesting was to see if there’s a consistent change between 2019 and 2020 by day of the week. To make this comparison, I calculated averages by day of the week, but for only the pandemic period of 2020 (March 12 – May 9), as compared with the matched days from 2019. This graph shows the comparison.
As we already saw earlier, this year’s April Conference drew more interest than last year’s. For every non-Conference day of the week, though, interest is down this year. This last graph converts the scores in the graph above to percentage differences to make them easier to compare.
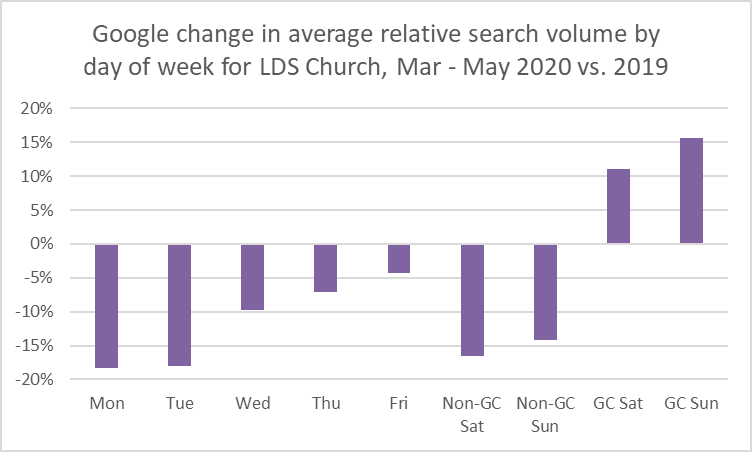
Scores in the middle of the week are down 10% or less, but on Saturday through Monday, they’re down 15-20%. Perhaps this just shows that mid-week interest was already low, so there wasn’t much to lose. Weekends, though, have a lot to lose with people no longer having Sunday meetings to prepare for or contemplate afterward (or at least having less preparation required if they’re meeting online).
I’m not sure that this metric will really tell you all that much, because of the structural changes that came from the suspension of services.
For example, when I have to prepare lessons to give on Sunday, particularly for adults, I will tend to do online searches a lot more. However, since the Church stopped holding weekly services, there’s no need to do lesson preparation to the same degree. Instead I focus on smaller-scale lessons for my children, and those lessons don’t require much (if any) online searches.
Are there some people who are just passing on anything Church related? Sure. But there are also a lot of people who are simply turning to other resources. For example, using the Gospel Library app on your phone or tablet wouldn’t show up in Google trends, and that’s where a lot of people would be turning to access the Church’s resources for at-home church.
Observer may be right–this may say nothing about what happens when Church reopens. Heck, even actual attendance after church reopens may not tell us what we think it’s telling us. But this analysis is a great idea. It will be interesting to see if the gap between 2019 and 2020 widens over time.
I do note you stuck with the name of the Church as a search term because of the smaller volume of results for others; would still be interesting to consider other terms that would be more likely for Mormon than non-Mormon to search. That is, I would be surprised if many members googled the name of the Church rather than going straight to the official website, or, when searching other topics, merely adding “LDS” to the search string to get the Mormon-specific sense of, say, baptism. I wonder if searches like “come follow me” or “home sacrament women” might not be more typical than the Church name as searches by members, perhaps indicating an ongoing effort at Church practice and a more likely eagerness to return to church activity.
In any case, I am continually amazed by your ability to come up with some test to measure a theory. Couldn’t have guessed at the start of this post how you could possibly address your question through stats … but you did!
It struck me a couple of weeks ago that there must be an uptick in YouTube searches for hymns. I know we use them for our Sunday home meetings and I never searched them prior.
Thanks for your comments!
Observer, you make a great point about how this difference may just reflect differences in what planning people have to do for home church versus regular church. I’m probably overinterpreting what I have here, even with cautious language.
Last Lemming, I agree! I’m really interested to see what will happen to this gap over time.
Ardis, that’s such an excellent point about Mormons searching versus non-Mormons searching. I’ve written a follow-up post using your suggestion, and it looks clear that you were right about there being a difference.
Gilgamesh, that’s an interesting idea. I should look into that too.