Who bears their testimony in fast and testimony meeting? I’m interested in this question not so much in the sense of which particular people do (“Oh, no, it’s Brother Mansplainer!”), but in the sense of whether it’s the same ten people every month or an ever-changing group.
To get some data on this question, I noted who in my ward bore their testimony in each of the 12 fast and testimony meetings in 2019. Of course it would be much better to have data from hundreds or thousands of wards and branches in different locations, but that would be really hard to get, so I decided to start with what I have. Unfortunately, I accidentally deleted data for one month when I got a new phone and factory reset the old one, so what I’m working with is 11 months of data. I excluded the testimony that’s always borne by the bishopric member who’s conducting the meeting, as I was interested in tracking testimonies borne by people who chose to do it, and bishopric members are pretty much expected to do it as a matter of course.
In the 11 F&T meetings, 99 testimonies were borne, or an average of 9 per meeting. These 99 testimonies were borne by just 44 people, so the average person who bore their testimony bore it 2.25 times in the year. The maximum number of testimonies borne by any one person was 9, and this was achieved by two people, so together they accounted for over 18% of all testimonies borne. Of the 99 testimonies, four came from visitors and two from missionaries serving in the ward.
Before I get more into the question of the same ten people, I thought it might be interesting to look at a breakdown of the testimonies by age and gender, which is shown in this graph.
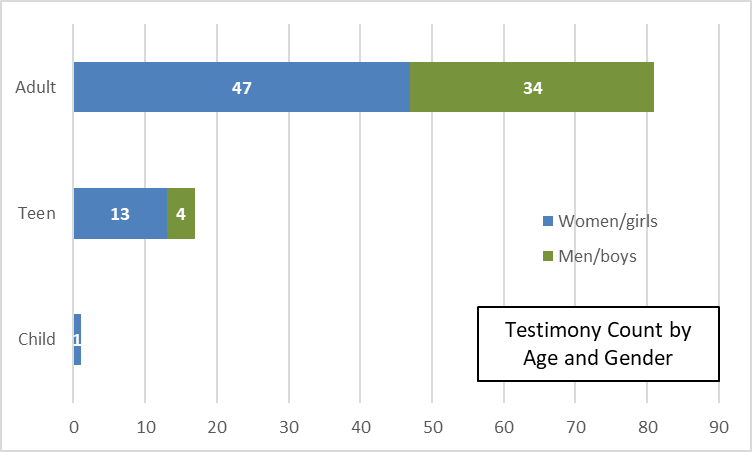
Most of the testimonies (82%) were borne by adults, with some teens (age 12-17) and only one child (age < 12). Women and girls bore more testimonies in all age groups (58% of adults, 76% of teens, 100% of children).
To look at the question of whether it’s pretty much the same group of people bearing their testimonies every month or different people, I calculated the Gini coefficient. This is a measure typically used by economists to find the level of inequality in income or wealth in a group of people. What I was measuring, though, was inequality in testimony-bearing. Given 99 testimonies borne, they could be borne by 99 different people, or by just nine people each bearing their testimony 11 times (assuming people stick to the convention of a maximum of one testimony borne per F&T meeting). The Gini coefficient ranges from zero (complete equality) to one (complete inequality).
One issue that came up with calculating the Gini coefficient is that I needed to account for all the people who bore their testimony zero times. I didn’t count the attendance in each meeting, but I did ask the membership clerk, and he said our sacrament meeting attendance is typically about 150. To account for visitors and people who move in and/or out of the ward, I guessed that a total of 200 unique individuals had attended one or more F&T meetings in the year. When calculating the Gini coefficient, then, I included 156 people (200 minus the 44 who bore at least one testimony) who bore zero testimonies.
The Gini coefficient is 0.86, which is a lot closer to complete inequality (1) than complete equality (0). This is probably not surprising given what I already mentioned above, about only 44 people accounting for the 99 testimonies, and two people each bearing nine testimonies. To test the sensitivity of the result to my assumption about how many people bore their testimonies zero times, I assumed a total of 150 unique attendees rather than 200 (i.e., assuming no move-ins, move-outs, or visitors) and recalculated the Gini coefficient. It came out to be 0.82, which is a little different, but is close enough that it gives me some confidence that the calculation isn’t too sensitive to my assumption about number of zeroes.
For comparison, I also calculated the Gini coefficient under a couple of hypothetical scenarios, as shown in the graph below.
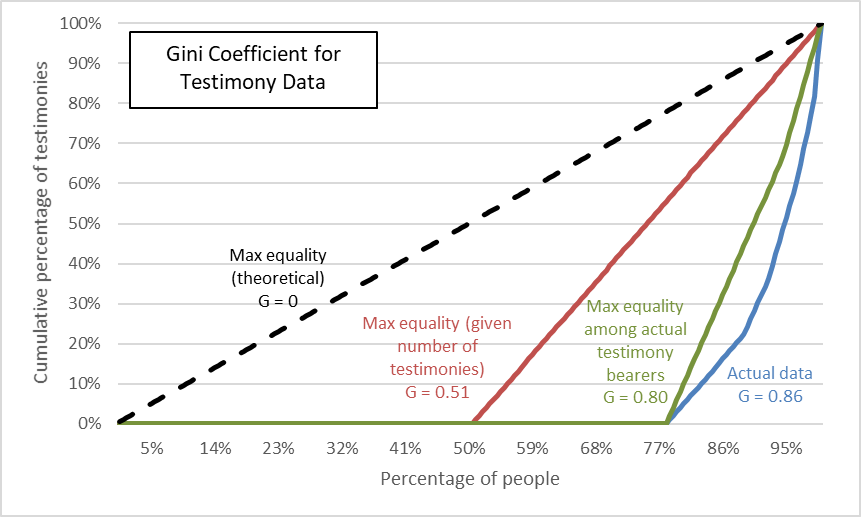 The graph is made by putting the people in order from the smallest number of testimonies borne to the largest number. Then, for each person, the cumulative percentage of all testimonies borne by that person and people before them (i.e., bearing fewer testimonies) is calculated. This cumulative percentage is what is shown by the lines in the graph. For example, for the dashed black line (maximum equality), the first 5% of people bear 5% of the testimonies, the first 10% of people bear 10% of the testimonies, and so forth for any percentage. For the blue line (actual data), by contrast, the first 78% of the people (156 out of 200) bear 0% of the testimonies, since as I mentioned before, only 44 people accounted for 100% of the testimonies. This is why the blue line stays at zero all the way out to 78% (although it’s hidden behind the green line). You can think of the area of the triangle underneath the dashed black line being defined as 1, and the Gini coefficient just tells how much of that area is above the curve for the actual data you’re looking at. For the actual data I’m showing here, 86% of the area of that triangle is above the blue curve, so the Gini coefficient is 0.86.
The dashed black line is, as I noted, the line of maximum equality. For the testimony data, this is not actually achievable, though, because there were only 99 testimonies borne among 200 people. Given that it’s not possible to divide them into fractional testimonies, it’s not possible to get to this level of equality. (I suspect economists don’t run into this issue when measuring inequality of wealth or income, as there are always far more dollars than there are people.)
The red line (which runs along the horizontal axis up to 51%) shows the maximum level of equality achievable given that only 99 testimonies were borne. This line shows the Gini coefficient (0.51) that would result if the 99 testimonies had been borne by 99 unique individuals.
The green line shows the Gini coefficient that would result if, as actually happened, 44 unique individuals had borne the 99 testimonies, but the 99 testimonies had been distributed among them as equally as possible (33 people bear two testimonies each and the other 11 bear three testimonies each). The Gini coefficient is 0.80 in this scenario, which is quite close to the Gini coefficient for the actual data (0.86, the blue line in the graph). This result indicates that the majority of the inequality in testimony-bearing is not in differences among people who bore at least one testimony, but rather in that such a large fraction of attendees bore zero testimonies.
I live in a suburban ward in the American Midwest. I’ve lived in and visited wards in several different US states, but most of them haven’t been too different from the ward I’m in now. I’ve never formally tracked who bore their testimonies in previous wards I’ve been in, but the results I’m showing in this post don’t seem too out of line with what I’ve seen before. I feel like the other wards I’ve been in have been similar in a couple of ways. I think women have typically borne their testimony more often than men. I think it has also been common for a few people to bear their testimony pretty regularly from month to month while the majority of the ward never bears their testimony at all. One difference is that I’ve definitely lived in wards where more children bore their testimony than is typical in the ward I’m in now. I know I’ve heard parents being asked to tell their children to bear their testimony in primary rather than in F&T meeting, but I’m not sure if that has been a local or a churchwide thing.
I’d love to hear about your observations of F&T meetings you’ve seen. Is it typically the same people bearing their testimonies every month? Do women bear their testimonies more than men, or is it more equal, or do men dominate?
This analysis is wonderful. I’m not sure I could pull it off very easily at this stage in my life, with my boisterous young children. I’d like to try sometime though.
In most wards and branches I have attended, there are usually a few people who speak in F&T meetings frequently, if not monthly. In branches, the number of frequent testifiers appears to be larger. Maybe because there are fewer people and it gets awkward when no-one stands up. Maybe people are more comfortable because the group is smaller and they know people better. In most wards I have attended I can think of at least one person I expected would always testify and some that would frequently. There are often people who get up who I cannot remember ever sharing their testimony as well though.
Thanks, Josiah! I think your point about maybe a few people dominating F&T meeting in smaller wards/branches makes a lot of sense.
I live in a ward in Utah County where the membership skews older, and the data sounds about right with my experience. Sometimes we have a number of men bear testimony, sometimes a lot of women, but I think women usually edge out the men a bit. There are definitely the frequent testifiers who get up nearly every month. In November we had only women get up for the whole hour, until right at the end a man got up and said “I guess someone from the priesthood had better bear their testimony this month”. I thought my teenage daughter was going to explode from indignation at that. I did notice more men bearing testimony this month (I need an eye-roll emoji)
As an aside, this kind of talk and attitude does not come from my bishopric at all. They always thank “the holders of the priesthood” after the sacrament and I’ve noticed are very conscientious about things like picking a sacrament meeting line-up that isn’t just men, as well as frequently picking open prayers that are given by women, etc. More than once this year we’ve had a sacrament meeting with all female speakers, so I know the bishopric doesn’t care if no one ‘from the priesthood’ bears their testimony.
I have been in wards that explicitly discouraged children’s testimonies, especially with parents coaching them, but this ward hasn’t. It still almost never happens, probably because we have a small number of children in the ward.
Thanks for sharing your experience, Jessie. It’s especially great to hear that your bishopric is good about making sure women are included in sacrament meeting!
Fascinating!!
You might consider crowdsourcing data to get a more representative sample across the Church.
I assume this kind of analysis could also be done for who gives talks in Sacrament Meeting — although that analysis would say more about the Bishopric of the ward and their choices. Of course there are likely good reasons why some people don’t speak in SM (and why some might not give testimonies for that matter — a Bishop might privately ask certain members not to get up in F&TM for a variety of reasons.)
Looking at the hymns sung in SM would also be interesting — especially with a new hymnal in the works (I’d guess it won’t be until 2021 at the earliest, given the huge number of submissions received). Before and after data given the new hymnal would be cool!
Thanks, Kent. I’d love to get the data on more wards, but it seems like a lot to ask of people, so I don’t think I’d actually do it. Especially given that it’s all likely to show not much interesting.
I think the questions about who gives talks and which hymns are sung are also good ones. On the latter question, you might like Samuel Bradshaw’s data at SingPraises.net. On the former question, I’ve been interested to learn recently as a friend of mine was called into his ward’s bishopric, just how difficult it can be to find people willing to give a talk in sacrament meeting. So I think such data would reflect not only the bishopric’s preferences, but also the ward members’ willingness to go along. I would guess (hope) that most bishoprics would prefer to have everyone in the ward (teens and adults) give talks, but I guess that might not always be the case. I know that in my own experience, when I told my current bishop that I would be happy to give a talk if he wanted, he (gently) told me that I’m too heretical to speak in sacrament meeting.
Ziff, this is so interesting! I love seeing a breakdown of who is speaking in wards, and particularly in testimony meetings.
After being indignant about having two all male sacrament meetings back to back several years ago, I started tracking male/female speakers in our ward. We were at 27% female to start, so I went to the Bishop with my data. He was shocked, and over two years made significant changes. By the time he was released, we were at almost exactly equal numbers of men and women speaking, even when factoring in the high council speakers that skewed that towards male sacrament talks. As you suggest in your comment, the hardest part about making this shift was getting people to accept. Sometimes the Bishopric would need to ask 5 women to speak before one would accept, and it required training and a culture shift to balance out the numbers.
Also, I would be glad to hear you speak in our sacrament meeting; I like your heretical posts!
Thanks, BeeCee! I’m glad you enjoyed the post! And I love that you recorded the gender breakdown of speakers in your sacrament meetings and then actually got the bishop’s ear and successfully prodded him to change it! Well done!