As you are no doubt aware, President Monson passed away Tuesday evening. As I have before when a member of the Q15 passes away, in this post I’ll show how the probabilities of becoming Church President change for the other members as a result.
All the probabilities come from a simulation I did for a post back in 2015. It’s a straightforward simulation: it uses an actuarial table and each Q15 member’s age and seniority in the quorum as inputs, and it draws a series of random numbers to simulate different possible life expectancies for each member. The life expectancies are then compared to find in what fraction of the simulations each member outlives all other members senior to him to become President. I did 100,000 replications for each run. That is, 100,000 times I drew random numbers for each Q15 member and compared them to his survival probability each year, and then worked out whether each member would become President or not in that scenario, and how many years he would serve if he did. For a more detailed description of the process, see my earlier post.
I realized when writing this post up that I had never done a post to show changes in the probabilities after Elder Hales passed away last October. I’ll start with that. This table shows the changes in probabilities and average number of years serving as President for the other Q15 members after Elder Hales died. Note that all the numbers, including ages, are as of October, 2017.
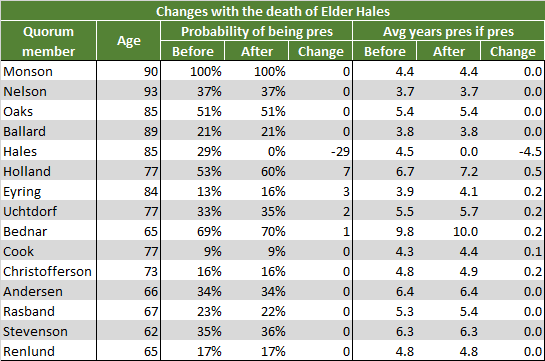
The reason I didn’t put this table together at the time of Elder Hales’s death is that I expected that little had changed. Elder Hales was quite a bit older than all members junior to him except for Elder Eyring, and Elder Eyring was already unlikely to become President because he was blocked by a much-younger Elder Holland. I have to say that the movements, while not large, are actually larger than I had expected. Elder Holland in particular got a seven-point increase in his probability, and a six-month increase in his expected term as President (assuming he becomes President). Elder Eyring, President Uchtdorf, and Elder Bednar also got smaller bumps in their probabilities of becoming President. There’s not much movement further down on the seniority list, as these men were already almost certain to outlive Elder Hales.
One other thing to note is that the change values in the table don’t exactly line up with the separate values they are showing change between. For example, for Elder Christofferson, the change from a 4.8 year average presidency length to 4.9 years is shown as 0.2 years. This isn’t an error, but rather it occurs because all three values are rounded separately. The unrounded values might be 4.76 years to 4.94 years, for a difference of 0.18 years, for example.
Here’s the table for changes with President Monson’s passing.
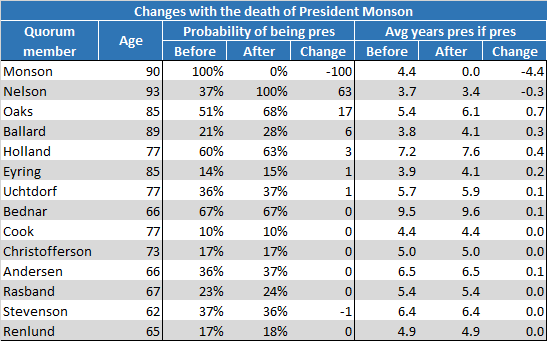
The obvious change here is that President Nelson went from having only a 37% chance of becoming President to having a 100% chance (assuming the Q15 doesn’t break with tradition or something unusual like that). As he was next in line, this just reflects that the actuarial table gave him a 37% chance of outliving President Monson. This fact really shows the limitation of the process of using the same actuarial table for all Q15 members, as it has seemed quite clear in recent years that President Nelson was in better health than President Monson, even though the age difference (and therefore the actuarial table) favored President Monson to live longer.
Elders Oaks and Ballard also got noticeable increases in their chances of becoming President. As with the previous table, there is little to no action further down in the seniority list, as the men in more junior positions were almost certain to outlive President Monson already. Note that Elder Stevenson’s chances decline by one percentage point. I’m pretty sure this is just a quirk of the simulation. I ran 100,000 replications each time, and by happenstance, he made it to President a little less often in the second run, that excluded President Monson. If I had run with more replications (a million or even more), his probability would likely come out to be virtually the same in the runs that included President Monson versus the ones that excluded him.
I’ll post an updated graph in the next few days that shows each Q15 members’ probability of being President at individual points in time in the future (like the lower graph in my 2015 post).
Love the work you do on these. As an engineer, MBA and one who loves data and what it can show, I am glad you’re willing to do the math, which shows interesting patterns that we cannot often see looking a tables of numbers or working from our own biases.
The only hard part of this for me is that the 3 hardest core members of the quorum have the highest probability of becoming “el presidente”, which to me, does not bode well for (to me) meaningful changes, but more hard line “obedience” and “trust us” even though we’re not going to be any more transparent, nor provide prophecy, seeing, or revelating, except for press room, proclamation kind.
Thanks, Paul. I’m glad you enjoy this stuff. I agree with you that I wish it weren’t President Nelson ascending to the top spot, or Elder Oaks next in line. I so wish someone with a kinder, gentler approach could be there. As a friend said to me recently, “Uchtdorf save us!”
I went back and reviewed some of your stellar stats and analysis from previous posts. They confirm what I suspected at first glance: President Nelson entered the Q12 with a much lower probability of becoming church president than any recent president. His probability was in the mid teens for the first 20 years he was an apostle. The passing of Elder Maxwell was what bumped President Nelson up to 20% probability. He had a lower chance back then than Elders Christofferson and Renlund do now. (Note that Elder Bednar is 7 years younger than Elder Christofferson)
As noted in the OP, this is just actuarial statistics. For the junior apostles, the actuarial tables are a pretty good measure. For the most senior brethren, you should look at the health and condition of those senior to any individual. For example, based upon their public appearances I thought that it was better than 50/50 that Elder Perry would become church president since for a while he was healthy and vibrant looking while President Packer could barely move and President Monson was obviously declining. The sudden passing of Elder Perry was what elevated the chances of President Nelson more than any other previous event.
Great point, el oso. That makes a lot of sense that the tables might be more predictive when someone is younger, but when (if) they’re older, then there are more individual differences. If I were more creative in coming up with some individual difference measure of longevity (like based on public appearances like you suggested, or based on lifespan of parents, as I’ve seen other people suggest) that might be a good way to improve the analysis.
As was noted earlier hopefully the Lord will intervene and Uchtdorf will be the next Prophet, otherwise the Church is going nowher.
The oldest man standing tradition has to be broken, for the sake of credibility and the Church
For comparison, here’s my update. Nelson’s “% chance of becoming President” is really “chance of surviving 2018”. “Primero” and “Secondo” are fictional new apostles called in April.
Apostle – % chance of becoming President – Avg years if pres
Nelson – 75.6% – 3.3
Oaks – 63.7% – 5.0
Bednar – 61.9% – 9.2
Holland – 57.2% – 6.6
Uchtdorf – 33.9% – 5.4
Andersen – 31.7% – 6.3
Stevenson – 30.5% – 5.6
Secondo – 27.3% – 4.1
Ballard – 27.2% – 3.5
Rasband – 24.3% – 5.6
Primero – 20.3% – 4.5
Christofferson – 19.2% – 5.2
Eyring – 17.5% – 3.9
Renlund – 15.9% – 4.6
Cook – 10.5% – 4.3
Geoff – A, I agree that it would be great if we could have a different way of selecting the next Church President. But of course that goes along with other complaints I have like that I wish the method of choosing new Q15 members would include selecting from a larger proportion of church members (including women!) And that it would be nice if Q15 members weren’t called for life. I don’t see any of these things changing in the near future, though.
Robert, thanks for giving your numbers for comparison. The similarity is comforting!
Geoff-A,
I think that disrupting the succession by seniority rule is highly unlikely. I do see some possibility of moving President Uchtdorf up to 1st counselor, but I think it more likely to happen when Oaks or Holland become church president if President Eyring is not in great health. If it were to happen with President Oaks’ administration, then Uchtdorf could be 1st counselor for 6-10 years, some of those with the president in failing health, and then he could have a relatively short tenure as church president. This is a fairly good possibility given the health and age of the senior apostles.
Of course, President Nelson could call a new counselor and Uchtdorf could go back to the Q12. Elder Bednar could be elevated. That is unlikely but possible.
I sat down last night to create a similar table of probabilities and was pleasantly surprised to find out the analysis had been done for me (THANKS!). I was wondering if you would share your code with us so we could iterate on it. I would love to see it committed to Github. I personally use R, but code in any language would be really useful. Thanks again.
Hi Nathan. I can’t speak for Ziff, but my stuff is all in an Excel spreadsheet. (I haven’t learned R; I mostly use SAS at work, but didn’t use it for this.) I could write up a description of what my spreadsheet does, and you could try implementing it in R on your end. Heck, I might try doing it up in SAS for fun. The core of it all, though, is an actuarial life table. I’ve been using the 2010 US Social Security life table; IIRC, Ziff’s been using a life table from the Society of Actuaries? Then it’s just Monte Carlo; run a simulation to see which of the current apostles dies when over the next, say, 30 years, see what that simulation says about who becomes church president when, lather, rinse, and repeat 100,000 times. 🙂
Thanks for your interest, Nathan. I ran this in SAS, although the last time I did it, Robert inspired me to run a version in Excel too. 🙂 I’ve emailed you the code at the email you used in your comment. Sorry, I’m not a real programmer and I haven’t actually used Github.
Robert, you’re exactly right. I’m using a table from the Society of Actuaries, and your description of the simulation is what I’m following too.
Ziff, thanks for the handsome SAS code. Robert, impressive work getting this done in Excel. I did a quick and dirty analysis in R and posted the code here. My answers look similar to Roberts, because I used the life tables from the SSA. Enjoy.
@Nathan: Very nice code base on GitHub; thanks for sharing! Your tidyverse code is equally impressive.
@Nathan, thank you.
@Ziff, could I see your SAS code as well?
Sure, Robert, I’ll send it over.
The problem with using the SSA table for this cohort is that all American lives from all economic backgrounds make up that table. Since the church leadership has more in common with white-collar retirees than the general public, I would use a white collar healthy annuitant RP-2014 table with an MP-2017 scale. My R/python skills are not good enough to get 2D mortality tables to work yet, but that is a 2018 goal.
Nathan, great to see your code as a template. Thanks.