If you look back through Church statistical reports released in every April Conference (and who hasn’t?), you find that it’s not exactly the same information that gets reported each year. I don’t mean that the numbers change; I mean that which categories of numbers even get reported change. There has been less change in recent years, but if you look back to the 80s, you’ll find lots of categories of information that used to be reported that aren’t anymore. For example, you’ll find number of babies blessed (last reported in 1988), number of boys and men who hold different priesthood offices (1986), number of proxy temple ordinances (1984), marriage rate (1983), and number of women in the Relief Society (1977).
I thought it might be interesting to look at what categories of information have been reported in statistical reports at different times, as well as how many total categories of information have been reported. This first graph shows how many line items (separate numbers representing different pieces of information) were in the statistical report each year from 1971 to 2014.
This graph shows the number of line items in the statistical report each year from 1971 to 2014.

It looks like almost all the change between 1971 and today occurred in the 1980s. In 1980, there were still nearly 40 line items each year. By 1990, the number of line items had fallen to about its present level of 10 or so.
Only six line items are present in every single statistical report from 1971 to 2014. They are counts of the following:
- Stakes
- Wards and branches (used to be reported separately, recently reported together)
- Missions
- Total members
- Baptisms, children of record
- Baptisms, convert
There are some obvious ones you might expect to be there every time but that weren’t reported some years. Number of missionaries, for example. That wasn’t reported from 1971 to 1976. Or number of operating temples. That wasn’t reported in 1977, 1985 to 1998, or 2001.
To look at what type of information is reported, I grouped the line items into larger categories. I did this because there are 72 unique line items appearing in at least one statistical report, and that seems like a bit much to try to cram into one graph. Fortunately, there are handy categories that the oldest statistical reports had line items grouped into, so I just used them. This graph shows which categories had at least one line item in the statistical report each year from 1971 to 2014.
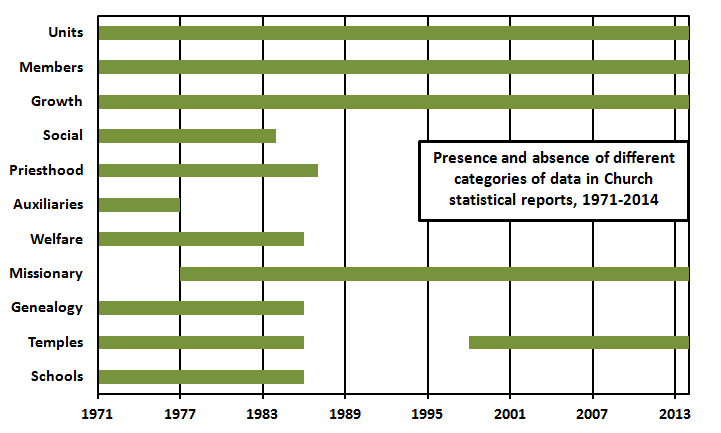 So, for example, the bar for units is present every year. This means that in each year, there was at least one line item in the units category included in the statistical report. These are things like counts of stakes, wards, branches, districts, missions, etc. This is the type of information in the remainder of the categories:
- Members: counts of members (in older reports, separated by stakes and missions)
- Growth: children blessed, children of record baptized, converts baptized
- Social: birth rate, death rate, marriage rate
- Priesthood: counts of men holding different priesthood offices
- Auxiliaries: counts of women in Relief Society, people in Sunday School, teens in YM/YW, children in primary
- Welfare: counts of people assisted, person-days of labor donated, orders from bishop’s storehouses
- Missionary: counts of full-time missionaries, service missionaries
- Genealogy: names cleared for temple ordinances, records microfilmed (in older reports)
- Temples: temples operating, planned, under construction, dedicated, re-dedicated; counts of ordinances for the living, for the dead (typically labeled “endowments,” although I assume this means count of names for which all temple ordinances were done)
- Schools: enrollment in seminary/institute, in Church schools
What drives which categories Church leaders (or employees) decide to include or exclude? When I wrote a post a few years ago looking at the actual numbers in the reports, it looked to me like in at least some cases, categories stopped being reported when they stopped being good news. This is clearest for the social statistics. For example, a long time, birth rates were high, and this was seen as something to be proud of, so they were reported. Then they started falling off, and pretty quickly thereafter, they stopped being reported. The same goes for counts of temples. There was a lull in construction in the 80s and 90s, and for a while, the number of operating temples wasn’t even reported. But when the temple building boom started in the late 90s and early 2000s, the count of temples started appearing in the statistical report again.
Of course, this hypothesis doesn’t work for many other categories that are no longer reported, like number of women in Relief Society or number of men holding different priesthood offices or amount of welfare assistance given or number of temple ordinances performed. I’m really not sure with those. Perhaps the report was stripped back to the bare bones because conspiring men in the Church’s statistics department (rightly!) feared that any numbers they reported would only be enabling to wild speculators like me. 🙂 Or perhaps that’s too narcissistic. I really have no idea. I’d love to hear your theories.
When it gets down to one item, they can rename it the Statistic Report.
Some of this may be a shift in where the statistics and other information are made available, rather than whether. I recall there being an “LDS Almanac” with much more statistical information than was given in General Conference. Here’s an LDS Church News statement about that:
“In the mid-1970s the LDS Church News first published a ‘Church Almanac’ that contained historical material relating to The Church of Jesus Christ of Latter-day Saints. These early Church almanacs contained biographical information for Church leaders, lists of Church departments and other statistical information.”
I haven’t looked at such a publication in many years, but there is a 2013 Almanac listed at Deseret Book. It may or may not have some of the items that disappeared from the General Conference report.
The number of missionaries not being reported is close to the time of the Vietnam war. I remember back then there was an effort to keep the idea if young going on missions and not being drafted rather quiet.
JrL – the Deseret News has announced that it will no longer be publishing a Church Almanac, so there goes another ton of information down the drain. David Stewart and Matt Martinich have recently published an almanac and they both do a good job of tracking certain statistics, but, since they are outsiders, they are limited in the information they have access to.
I enjoyed your post. I think the main reason the Church doesn’t publish as much information is to try to avoid giving its critics ammunition. You’ve pointed out that when numbers start looking bad, items are dropped from the report. Here are my thoughts in response to your specific questions:
Number of women in RS? They don’t want to emphasize that there are many more women than men in the Church. Men holding priesthood offices? The same thing. Plus, it would highlight the vast number of people who are counted as members but who don’t consider themselves members. I think you would find a great discrepancy between the sum of the number of men and women each unit reports as belonging to the priesthood or relief society and the total membership reported by the Church.
Amount of welfare assistance given? The numbers would give critics an opportunity to contrast that with how much the Church is said to earn from tithing receipts and commercial ventures. I would love to see a breakdown of the amount of welfare assistance given between the United States (where the assistance might be a better suit of clothes or sofa) and the really impoverished countries, (where children are suffering from malnutrition). My understanding is that the overwhelming majority of funds (even on a per capita basis) are spent in the United States.
Temple ordinances performed? I’m glad they stopped reporting this one, since it is sort of meaningless. Anyone who has done genealogical research on the Church’s website has discovered that the same ancestor has had temple work done for them many different times in different temples.
The decline in detailed reporting corresponds pretty well with program consolidation of the 1980s. The three-hour block started in 1980, and local ward budgets were replaced with the unit budget allowance in 1990. It’s a simpler, less detailed church now. If you go back to conference reports only a couple decades before 1971, the were not only numbering lots of things, but naming them too. In the April ’48 report , Joseph Anderson named the two new missions, the four new mission presidents, the two new stakes, the eleven new stake presidents, half a page of new wards, the four discontinued wards, the three branches made wards, the nine new branches, and the one discontinued branch.