This post comes to us from Christian Anderson, a biostatistician living in San Diego county. He previously guest posted on mentions of Heavenly Parents in General Conference.
In the Saturday Afternoon Session of General Conference on Apr 1, 2017, the church announced a membership of 15,882,417. Combined with last year’s total, this represented an increase of 248,218 members and 1.59%. For many denominations, this would be a banner year. However, for the LDS church it represents a remarkable underperformance relative to historical trends and enthusiastic predictions by some members.
Absolute growth
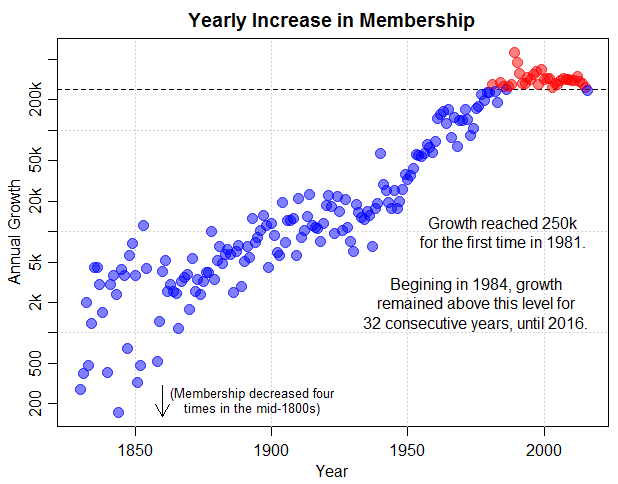
In terms of absolute growth, the addition of nearly a quarter million members is still a substantial achievement. After all, the church didn’t reach 250,000 members total until 1897. However, since 1984 the church had reported growth of at least that magnitude for 32 consecutive years until last Saturday. Reported is an important word here, as membership totals reported in General Conference were rounded off to the nearest 10,000 from 1984-1991, and there are several statistical anomalies in the various time series suggesting that totals sometimes reflect incomplete reports (usually reflected by an anomaly in the opposite direction in the next year).
Percent growth
Again, the church is still growing substantially, but appears to be doing so at a decreasing rate. Percent growth is a slightly more complicated statistic to interpret. If the church added the same number of members every year, the percent growth would still decrease geometrically as the base membership increases. The recent decrease in percent growth should be interpreted with this in mind.
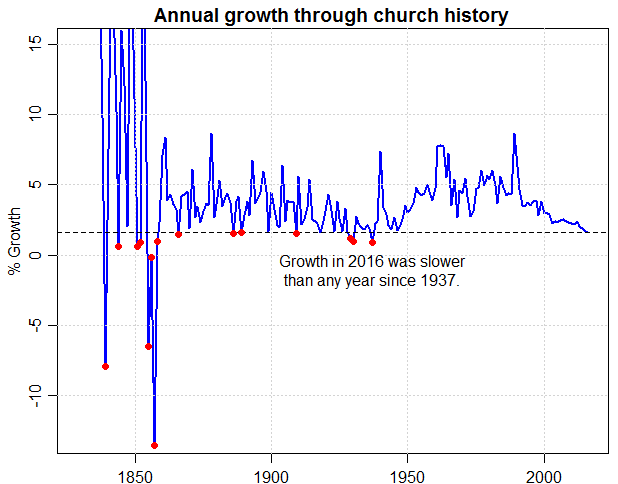
The growth of 1.59% in 2016 was the lowest single-year growth since 1937, and thus the slowest rate of growth in the lifetimes of nine of the fifteen apostles. It was the fifth slowest growth rate since 1900.
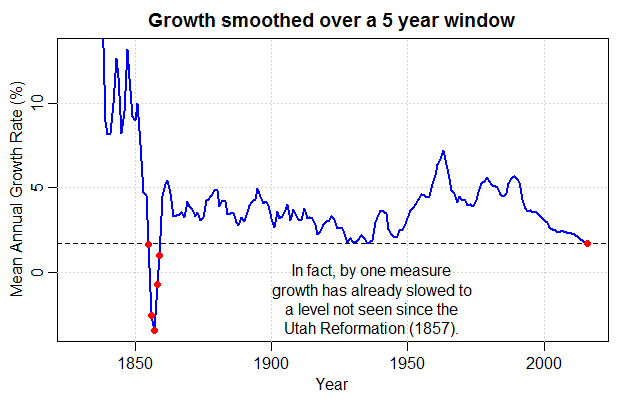
Unlike many previous low spots through church history, this growth rate was not an isolated “off-year”, but continued several years of growth rates that have been consistently lower than any time since World War II. In fact, smoothing the data with a five-year sliding window (i.e., averaging all available growth rates from two years before to two years after the target date) results in us being in the slowest period of church growth since 1857, a year notable for Brigham’s Reformation, the Utah War, and the Mountain Meadows Massacre. However, it is important to note that this is almost the only way in which the recent slump comes out looking more severe than other lows in the 1930s and 1890s; wider windows and different averaging formulas generally support the contention that this is the slowest period of growth since WWII, but not since the 1850s.
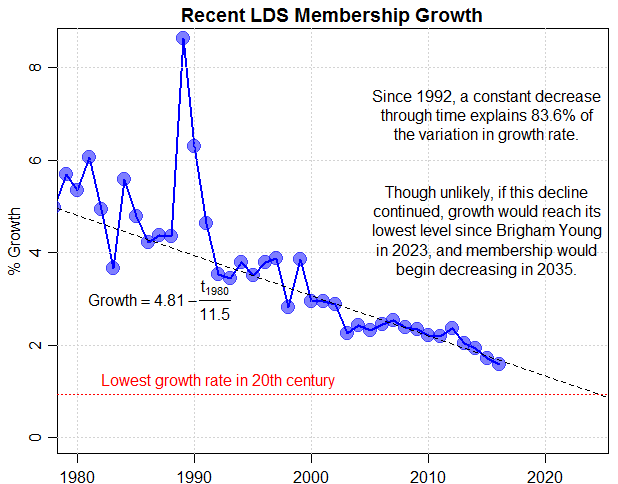
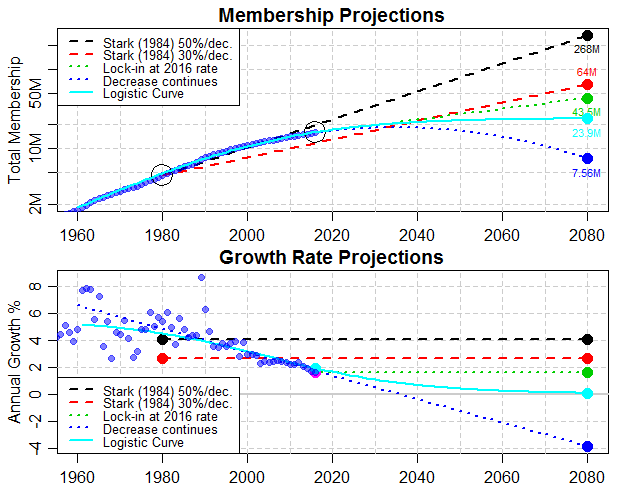
 As the church becomes larger, the high variability in year-by-year growth rate is expected to smooth out, and that appears to be the case. This makes trends in growth rates easier to pick out, and more statistically significant. As noted above, while growth rate reached a historic low this year, it was a continuation of a decreasing growth rate that has been going on for decades. The trend is both consistent and remarkably uniform. A simple decrease of about 0.09% per year from 3.8% in 1993 explains over 5/6ths of the variation in the last 25 years of growth rate. Extrapolating this back to the 4.81% growth rate of 1981 visually seems to be a reasonable fit for most of the data for over a decade earlier as well.
Projecting future growth
Modelling future growth is an extremely difficult and often inexact science. For example, the above analysis predicts that the church’s growth rate will drop below the 20th-century minimum value of 0.93% in 2023, and will drop below zero in 2035, representing a peak in membership. There are many reasons to think this will not be the case, including the church’s generally high fertility rate, the likelihood of changes in the missionary force and mission field availability, changes in the weight of different geographic regions in church books, and updates to institutional bookkeeping procedures. These factoids should be taken as indications of the path we’ve taken recently, not necessarily the path we will continue to stay on.
BYU demographer Rodney Stark has been widely and somewhat unfairly criticized for a back-of-the-envelope prediction he made regarding church growth in 1984. He noticed that most decades, the church seemed to grow somewhere around 30%, but had been growing very roughly by 50% since World War II. He therefore simply took the 1980 membership total (using fewer significant digits in his calculations than printed in his paper), and applied 50% growth 10 times to estimate a 2080 membership of 265 million. He immediately followed this with the 30%/decade growth rate, which predicted “only” 63 million members. While he cautioned that “straight-line projections are risky; they assume the future will be like the past”, he did, however, try to defend both figures as reasonable projections in both that paper, and as recently as 2011 in the Deseret News.
The biggest problem with this model is it assumes exponential growth (a constant percent growth through time) is sustainable in the long-term; a fallacy which scientists since Malthus have warned against. J-curves always become S-curves (if not inverted-U) eventually when dealing with a limited resource such as the number of human lives on the planet. Continuing Stark’s high-growth model suggests that there would be 15.4 billion Mormons by 2180, and 2.0 trillion by 2300 (compared the UN projections (p. 15 at the link) that the world population will be 9.2 billion and 9.0 billion at these dates.
Stark’s model assumed no deceleration would occur until the late 21st century, and that no variability would occur in growth rate during the time period [SIDE NOTE: the average growth rate of an exponential process needs to be calculated as a geometric mean, rather than the arithmetic mean, because a slow year has proportionally more effect downstream than a fast year. If you invest $100 over ten years, gaining 100% interest once and 0% the other nine years, you always end up with $200 no matter which year you gain the interest; if you gain 10% interest each year you end up with $260.]
But before we laugh off Stark’s models as absurdly optimistic, keep in mind that church growth actually OUTPERFORMED even the high-growth model until 2004. The 1980s saw 67% growth, and the 1990s saw 42.6% growth. Current church membership of 15.8M is right between his high projection of 20.6M and low projection of 12.1M for 2016 (interpolated). So he may have been optimistic in thinking deceleration wouldn’t occur for 100 years, but he seems to have done fairly well for almost a third of that time span.
Last year’s statistics indicate 17.1% growth / decade (to use Stark’s units). If the church is able to halt the decline and keep that rate constant as in Stark’s exponential growth model, membership would reach 43.5M by 2080 (what I call the “Lock-in @2016” model below). If the church is able to rebound to the historic levels of 30% or 50% growth per decade, membership will reach 85M or 213M. If, however, the decline continues at the same rate as it has over the past 25 years, membership will peak at 18.5M in 2035, and dwindle down to 7.6M by 2080 (the “decrease continues” model).
All of these scenarios are fairly unlikely. A common alternative to exponential growth is logistic growth, sometimes called an “S-curve” model, where growth accelerates for a time, then decelerates as it approaches a maximum value or carrying capacity. Fitting a simple logistic curve to membership data since the 1930s suggests that membership will plateau near 25M. While this model makes more reasonable assumptions about future growth, it contains no mechanisms for what drives the deceleration, rejects the hypothesis that growth is cyclical on the mid-term and will pick up again for another few decades, and because the deceleration is fairly recent, the exact value of the plateau is only a rough estimate.
Changes in conversion rates
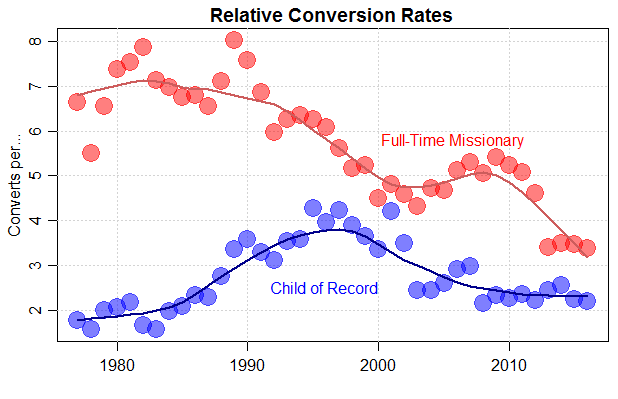
The church has long prided itself on its large and effective missionary program, and that more people join the church from outside than are born into it in contrast to many other large denominations. This remains the case. However, the number of full-time missionaries has declined to approximately 71,000 from a peak of 85,000 two years ago in response to the change in missionary age restrictions. The effectiveness of individual missionaries has been in a long term decline, with converts per missionary reaching the historically low value of about 3.5, during both the peak and post-peak years. The number of children born into the church increased in 2008 to about 120,000, but has stagnated there since (decreasing to 109,000 in 2016). The number of converts per child-of-record has also been stuck at about 2.3 over the same time period, a decline from a peak of about 4 in the mid-1990s.
 Other items of interest from the April 2017 Conference
- Only one woman spoke during the main conference weekend for the first time since the early 1990s.
- However, for the first time in recent memory, women cited verses more frequently than men (though far fewer in total because so few women spoke). Generally, women refer to scriptural verses roughly half as frequently as men. Carol F. McConkie referred to 28 verses in her short talk, the third most by any speaker.
- Though the number of verses cited per session had been steadily drifting upwards since the 1970s, the 547 verses referenced by speakers in April was in the bottom quintile of conferences since 1974, and was the 10th time in the last 13 sessions the total fell below the trendline.
- Moses 1:39 (“my work and my glory”) has the most total citations of any verse of scriptures since 1974, and was again the most cited verse this session, referred to by five different speakers. The second most cited verse of scripture, Mosiah 18:9 (“mourn with those that mourn”) was not referenced by any speaker for the second time in the last 20 sessions.
- The Family Proclamation received six citations to pad its lead over Moses 1:39 as the most referenced text (234 citations since Oct 1995, vs Moses 1:39’s 93 hits over the same time period). Interestingly, four of these were in a single paragraph in Elder Ballard’s address, where he seemed to privilege “The Living Christ” over it. This is particularly significant given Ballard has now cited the FamProc almost twice as often as any other speaker.
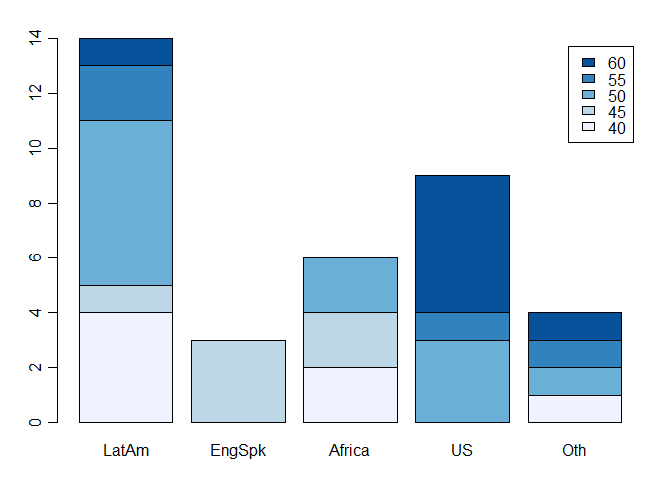
- DIVERSITY: The 36 new Area Authority Seventies represent a wide range of cultures and languages. Twenty-seven are from outside North America, and 23 are from non-Anglophone countries. Perhaps more significantly, the international representatives appear to be entering the “leadership pipeline” at a younger age than their domestic counterparts, an important consideration in an organization that often functions as a gerontocracy.
 Similarly, of the six new General Authority seventies, two are from Utah, two are from Brazil (one of whom also spent substantial time in Mozambique), and one each from Peru and Fiji. The new Primary second councilor Cristina B. Franco is Argentinian (breaking up the identically-coiffed Primary Presidency after just 12 months). The new Relief Society presidency consists of a Utah native with four college degrees and a history of work with immigrants, a Californian who will continue to direct LDS Charities, and a Nicaraguan computer scientist. The Young Women’s surprisingly diverse general board remained intact.
- Using the same methodology I used in (Dialogue Spr 2017; in press), making some reasonable assumptions about death rates and removals, the membership statistics suggest approximately 30,000 members were excommunicated or resigned in 2016, bringing the total for the last four years to just over 150,000. This value is based on several fudge-factors, and should only be taken as a rough order-or-magnitude guess. Randall Bowen at churchistrue.com used different fudge-factors (including assuming an increasing rate of removals of 110 year old lost members, and 9 year old children of record who had not been baptized) to arrive at an estimate of 20,000 defecting members in 2016 and about 95,000 over the last four years.
Thanks for this, Christian! Really interesting stuff.
Great analysis. Thanks.
Thanks for this post, Christian. Your analyses are really interesting. You said at one point: “wider windows and different averaging formulas generally support the contention that this is the slowest period of growth since WWII, but not since the 1850s.”
I’m not that familiar with the history of how missionary work has been handled, but wasn’t it during President Kimball’s time that the norm of all young men service a mission was really first pushed? I guess what I’m getting at is that if the current period of growth is the slowest since something roughly approximating the Church’s current missionary approach has been in vogue, then perhaps it suggests that perhaps our whole approach to missionary work needs to be completely re-thought.
This was a fun and interesting read! There are, to my mind, two more considerations worth nodding at in analyzing membership growth.
First, the absolute number of members is for many purposes less relevant than the Mormon share of the population. If the number of Mormons holds steady but global population grows, then Mormons will (feel and) be watered down. Political, economic, and cultural influence are relative, not absolute — and you can’t fill the whole Earth very well without growing as a proportion of the population. For these reasons, the global population growth rate (currently around 1.1%) is a key benchmark along with the 0% threshold.
Second, it’s worth thinking about shifting composition over time. It’s well known that the official number of on-the-books Mormons is much higher than the number of people who would self-describe as Mormon in, eg, an anonymous survey. But also, these patterns have geographic structure. Membership numbers in North America are relatively high-value, while numbers in Latin America and Europe seem particularly hollow. Thus, a given growth rate means much more if the growth is concentrated in North America and perhaps Africa than if the same growth rate is focused in South America. I don’t know the geography of the recent growth, which obviously matters a great deal!
Very interesting! Thank you. A question: could the phrase “BYU demographer Rodney Stark” be a mistake? I am not aware of any part of his career that he spent at BYU except as a guest speaker and writer.
Great points, RoastedTomatoes.
Matt Martinich maintains a vastly more-detailed database that addresses these points (and *many* others) in great detail. He occasionally skews a bit more apologetic than I would in his interpretations, but his data are always solid and he doesn’t hide from anything. His post here: http://ldschurchgrowth.blogspot.com/2017/04/membership-by-country-statistics.html addresses your second question directly, and notes that while growth rates have fallen to almost half their recent levels in the US and the major Latin American countries, the largely domestic missionary force and leadership in West African countries is having a lot of success.
He also has a (slightly out of date) article about inactivity abroad here, pointing out the vast discrepancies between church-claimed membership in Latin America, and self-reported membership in national censuses. Since the article was written, the 2010 Mexican Census reported OVER A MILLION fewer members than the church claims. http://www.cumorah.com/index.php?target=church_growth_articles&story_id=36
What is the rate & percentage of those leaving the mormon church and the percentage of active membership (paying a full tithing and special assessments as well as active temple participation)?
Edy Meredith: The Church releases no official statistics on these categories, and is remarkably tight-lipped unofficially as well. So everything that follows are shot-in-the-dark guesses.
Several people have tried to get at these answers using a variety of methods. As noted in my last bullet point, there is general agreement that the last four years have seen a noticeable uptick in the disparity between “new members” (= converts + children of record) and growth (“this year’s membership” – “last year’s membership”). Since it is unlikely that there has been a worldwide jump in the LDS death rate, this is widely attributed to an increase in “defections” (=resignations + excommunications). I estimate about 150,000 over the last four years, which is an annual rate of about a quarter of 1%. Others say higher, others say lower.
Activity, defined as church attendance, is highly variable geographically. The numbers you hear most often are 25%-33% in North America and ~10-20% everywhere else. Here’s Martinich’s take on it: http://www.cumorah.com/index.php?target=church_growth_articles&story_id=13
Leaked videos show LDS authorities discussing a 25% activity rate world-wide among “young people”. http://religionnews.com/2016/10/05/leaked-worldwide-only-25-of-young-single-mormons-are-active-in-the-lds-church/
Martinich also recently gave an interview where he claimed that because the number of stakes increased 2.9% last year (relative to 1.59% increase in membership), that indicates a growing activity rate. Personally, I don’t buy it, not least because units only increased by 0.96%, but make up your own mind. https://wwrn.org/articles/45487/
Tithing and temple attendance are much lower. The last official records we have on tithing are from 1890-1925, thanks to D. Michael Quinn (Chapter 6, Section 2 of “Extensions of Power”), which indicated that even in extremely LDS-centric early 20th-century Utah during a time of heavy emphasis on tithe-paying, between 15% and 30% of members paid “some” tithing. Full tithing would of course be much lower.
Temple attendence is also quite low. Due to law suits by locals in areas where temples are being built, the Church has needed to publish studies indicating the expected level of temple attendance, which were at first rejected by the court as being too low to be credible until coroboration was offered. I can’t find the exact numbers, but I think it was between one and two dozen people were expected to be in the Dallas TX temple at any one moment Tue-Sat. Internationally, a non-LDS researcher claimed that 2% of nominally LDS people lived in an “Ensign family” (mother and father sealed in the temple with children).
All these “rates” depend on counting everyone who has ever been baptized (and not confirmed dead) as LDS, which is a highly inflated statistic relative to other denominations. For example, Adventists count only self-identifying members; while JW’s count only people who actively proselytize. Adopting the Adventist metric, both of those denominations have about twice as many “real” members as we do. Here’s a great lecture on the subject: http://sunstonemagazine.com/audio/SL10336.mp3
I’m sorry there isn’t a better answer to your question available.
I think we will see an accelerated decrease in growth, which would result in peak membership of 17M 10yrs from now in 2027, with less than 4M members by 2050.
The genx have lost interest in Mormonism and most units are only retaining 5 – 15% of millenials 18 – 30. I think it will be very difficult to baptize 200k new members in 2017.
Please fix the scale of the Y-axis on the first “Yearly Increase in Membership” chart…
Ziff, I think that was exactly the idea behind the Facebook missionary stuff that people were so psyched about four years ago, but it seems to have completely fizzled out. No one talks about it, I can’t remember the last time I saw a missionary on Facebook, and when I happened to ask a missionary in the field she said they were only allowed to use Facebook to contact people in their own area. So much for “Now we can reach anyone in the world!” (which of course was nonsense anyway because if proselyting is illegal in person it’s just as illegal online. And in China, Facebook is banned altogether.) But anyway, I think the whole approach to missionary work is being re-thought, it’s just taking forever and hasn’t yielded noticeable results yet.
As a stats nerd this was a fascinating article. Thanks for sharing.
Out of curiosity, what are you using to generate your graphics?
dallen allred, I’m pretty sure the Y-axis in the first graph uses a logarithmic scale.
I think the religion will be history by the end of my lifetime. But the true gospel will go with power into all the world.
Sorry I missed comments earlier. Yes, dallen allred, the first graph uses a logarithmic scale; otherwise you wouldn’t be able to see growth in the first ~2/3rds of the history.
orangganjil: All graphics and analysis were done in R. If you’d like the data and/or the scripts, just let me know.