In the past few days, many Americans have been remembering the terrorist attacks of September 11, 2001. One thing that strikes me in thinking back to where I was at that time is that it sure doesn’t seem like it has been a decade and a half since that awful day. It feels like it has been a few years at most. I’m in my forties, and I think this is a common experience: time feels like it moves faster as we get older. I look at my kids, particularly my five-year-old, and how unbearably long an hour can be for her, or a week, or how wonderfully long a summer can be. For me, they’re all gone in a flash. One day it’s Memorial Day, and then I turn around and it’s Labor Day and summer is on the wane. And then I blink and it’s Christmas, while of course for my five-year-old, that same amount of time on the calendar has taken forever to pass.
One theory (attributed to the philosopher Paul Janet) for why this happens is that as we age, each successive year (or whatever unit of time you like) constitutes a smaller and smaller fraction of our lives. When you’re five, for example, the next year is as long as 20% (1/5) of your life, whereas when you’re 50, the next year is as long as 2% (1/50) of your life. The result is that each successive year feels shorter than the previous one, and this difference is particularly dramatic between the first few years of life, when the years pass relatively slowly, and most of adulthood, when they’re shorter and similar in length. Here’s an article talking about this theory in a little more detail, and here’s a cool visualization created by a designer named Maximilian Kiener that really illustrates it well.
I thought it might be interesting to use Janet’s theory to get a sense of how long ago Q15 members perceive historical events to be. From the way many of them often talk about the evil they feel is relentlessly increasing in the world, I wonder if part of what they’re feeling isn’t just caused by the perception that time speeds up as you get older. If bad things happen at a fairly regular pace, as time feels like it’s going faster, the bad things seem closer together in time. And as many of the Q15 are really quite old, time likely feels like it’s going extremely fast for them.
I wanted to look at differences in perceived time since a particular event as a function of age, so to have something concrete to work with, I chose six historical events that might be particularly memorable for Q15 members. I chose events recent enough to be within the lifetime of all current Q15 members. Three of the events are directly related to the Church, and the other three are US Supreme Court decisions that they probably disapproved of. I chose the Supreme Court decisions because they provide a single memorable date, rather than a more vague and diffuse date range that might be applied to a social movement associated with a decision. And as you can probably guess, I chose decisions from the US because it seems clear that GAs don’t pay much attention to political movements or decisions in other countries. Here are the six events I chose:
- Griswold v. Connecticut (1965), which established a right to privacy, and overturned anti-birth control laws for married couples.
- Roe v. Wade (1973), which extended the right to privacy to cover abortion
- Revelation ending the priesthood/temple ban for black people (1978)
- Family Proclamation (1995)
- Lawrence v. Texas (2003), which struck down anti-sodomy laws.
- Proposition 8 in California (2008)
For a year experienced at each age, I used Janet’s theory to find its perceived length by just calculating one divided by the person’s age at the beginning of the year. This yields perceived length as a percentage of the first year of life. The first year counts as 1, and then, for example, when you’re four, the next year is perceived as 1/4, or 25% as long. I thought it might be more meaningful to have an older age serve as the standard, so I multiplied all the perceived lengths by the age-18 perceived length. This makes the resulting perceived lengths percentages of an age-18 perceived year, which I think is easier to think about. For example, if you’re 50, then the next year feels like it’s about 36% as long as a year did when you were age 18. (For the rest of this post, I’ll refer to an age-18 perceived year as a perceived year.)
For each event, I used these perceived year lengths to calculate how many perceived years in the past the event feels like for each member of the Q15. For example, take Griswold v. Connecticut and President Nelson, who turned 92 this year. I totaled up all the perceived lengths for his last 51 years (because Griswold was 51 years ago), so ages 41 to 92, which yielded a total of 14.4 perceived years. To make this number more meaningful, I also converted it to a percentage of his perceived life. To do this, I totaled up the perceived lengths for all 92 years of his life, which gives 91.9, and divided 14.4 by that to get 16%. (Note that it’s a coincidence that his totals of perceived years and actual years are so similar; for people at younger ages, the perceived total is higher. This is just a result of my choice to use age-18 perceived length as a standard.) I also calculated the actual percentage of his life that has passed, which is just 51/92, or 55%. Finally, for comparison to the Q15 members, I also made similar calculations for a 10-year-old, 20-year-old, 30-year-old, 40-year-old, and 50-year-old. I didn’t include ages beyond 50 because at that point, you can just use Q15 members themselves for comparison. For example, Elder Stevenson turned 61 this year.
This graph shows results for all Q15 members and the comparison ages for Griswold v. Connecticut.
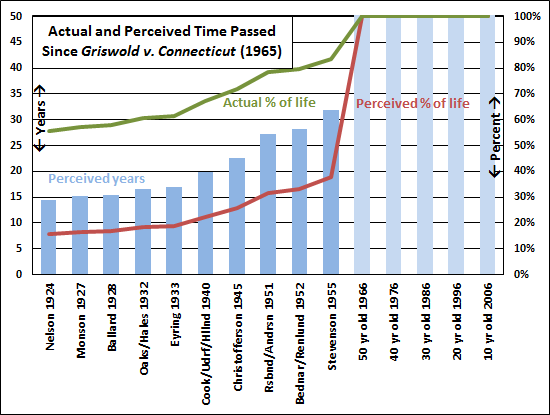 The Q15 members are listed across the bottom, in age order, with their birth years. Note that there aren’t 15 bars to represent the Q15 because some members were born the same year. The blue bars (referring to the left vertical axis) show perceived years, so the first one is President Nelson’s 14.4 perceived years. The blue bars for the comparison people aged 10 through 50 are faded to indicate that this event occurred before they were born. The red line (referring to the right vertical axis) shows the perceived percentage of the person’s life since Griswold. The green line (also referring to the right vertical axis) shows the actual percentage of the person’s life since Griswold.
I did one other thing to try to make the results more relatable. For each Q15 member (or group of members born the same year), I took his perceived number of years since Griswold and then for each of the comparison people aged 10 to 50, found the year that is the same number of perceived years in the past. So again, with President Nelson, Griswold is 14.4 perceived years in the past. If you’re 50 years old, what year feels 14.4 years in the past? I just counted up perceived years going backward for a 50-year-old, and found that it takes 28 years to get to 14.4 perceived years, so the answer is 28 years ago, or 1988. Here’s a table showing results for all the comparison people compared to all the Q15 members.
| Matching perceived years since Griswold v. Connecticut (1965) | |||||||
|---|---|---|---|---|---|---|---|
| Q15 member(s) | Born | prcved yrs since 1965 | Year same perceived number of years in the past for | ||||
| 10 yr old | 20 yr old | 30 yr old | 40 yr old | 50 yr old | |||
| Nelson | 1924 | 14.4 | 2010 | 2005 | 1999 | 1994 | 1988 |
| Monson | 1927 | 15.2 | 2010 | 2004 | 1999 | 1993 | 1987 |
| Ballard | 1928 | 15.5 | 2010 | 2004 | 1998 | 1993 | 1987 |
| Oaks/Hales | 1932 | 16.7 | 2010 | 2004 | 1998 | 1992 | 1986 |
| Eyring | 1933 | 17.0 | 2010 | 2003 | 1997 | 1991 | 1985 |
| Cook/Udorf/Hllnd | 1940 | 19.8 | 2009 | 2002 | 1996 | 1989 | 1982 |
| Christofferson | 1945 | 22.5 | 2009 | 2001 | 1994 | 1987 | 1980 |
| Rsbnd/Andrsn | 1951 | 27.1 | 2008 | 2000 | 1992 | 1984 | 1977 |
| Bednar/Renlund | 1952 | 28.1 | 2008 | 2000 | 1992 | 1984 | 1976 |
| Stevenson | 1955 | 31.8 | 2007 | 1999 | 1991 | 1982 | 1974 |
As you would expect, as you move down and to the right in the table, the ages of the comparison people and the Q15 members get closer and closer, so the year matches get closer and closer to the year being compared for the Q15 members (1965).
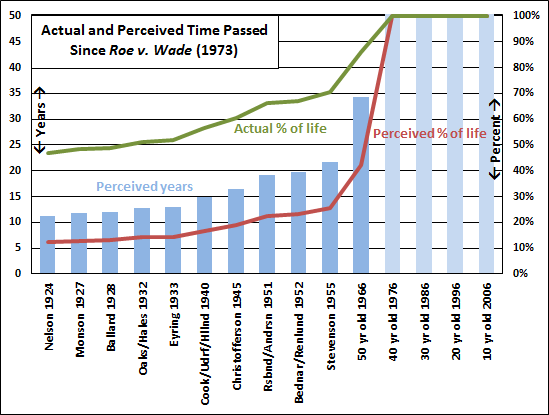
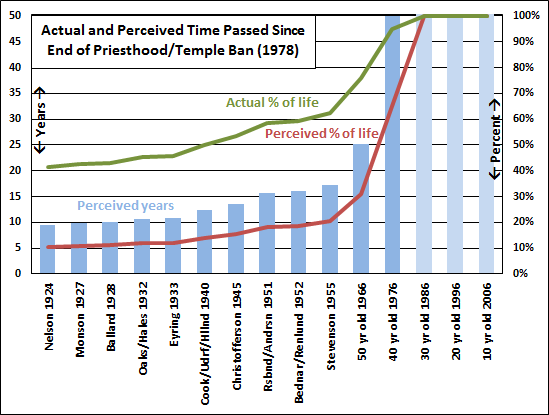
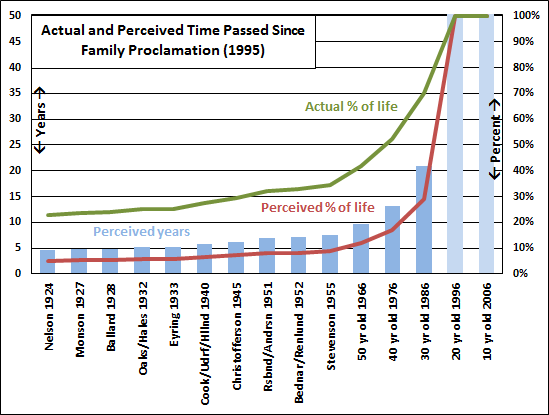
Below are similar graphs and tables for each of the other five events on my list.
| Matching perceived years since Roe v. Wade (1973) | |||||||
|---|---|---|---|---|---|---|---|
| Q15 member(s) | Born | prcved yrs since 1973 | Year same perceived number of years in the past for | ||||
| 10 yr old | 20 yr old | 30 yr old | 40 yr old | 50 yr old | |||
| Nelson | 1924 | 11.3 | 2011 | 2006 | 2002 | 1997 | 1993 |
| Monson | 1927 | 11.8 | 2011 | 2006 | 2001 | 1997 | 1992 |
| Ballard | 1928 | 12.0 | 2011 | 2006 | 2001 | 1996 | 1991 |
| Oaks/Hales | 1932 | 12.8 | 2011 | 2006 | 2000 | 1995 | 1990 |
| Eyring | 1933 | 13.0 | 2011 | 2005 | 2000 | 1995 | 1990 |
| Cook/Udorf/Hllnd | 1940 | 14.9 | 2010 | 2004 | 1999 | 1993 | 1988 |
| Christofferson | 1945 | 16.6 | 2010 | 2004 | 1998 | 1992 | 1986 |
| Rsbnd/Andrsn | 1951 | 19.2 | 2009 | 2003 | 1996 | 1989 | 1983 |
| Bednar/Renlund | 1952 | 19.8 | 2009 | 2002 | 1996 | 1989 | 1982 |
| Stevenson | 1955 | 21.6 | 2009 | 2002 | 1995 | 1988 | 1981 |
| Matching perceived years since end of Priesthood/temple ban (1978) | |||||||
|---|---|---|---|---|---|---|---|
| Q15 member(s) | Born | prcved yrs since 1978 | Year same perceived number of years in the past for | ||||
| 10 yr old | 20 yr old | 30 yr old | 40 yr old | 50 yr old | |||
| Nelson | 1924 | 9.5 | 2012 | 2008 | 2003 | 1999 | 1995 |
| Monson | 1927 | 9.9 | 2012 | 2007 | 2003 | 1999 | 1995 |
| Ballard | 1928 | 10.1 | 2012 | 2007 | 2003 | 1999 | 1994 |
| Oaks/Hales | 1932 | 10.8 | 2011 | 2007 | 2002 | 1998 | 1993 |
| Eyring | 1933 | 10.9 | 2011 | 2007 | 2002 | 1998 | 1993 |
| Cook/Udorf/Hllnd | 1940 | 12.4 | 2011 | 2006 | 2001 | 1996 | 1991 |
| Christofferson | 1945 | 13.6 | 2010 | 2005 | 2000 | 1994 | 1989 |
| Rsbnd/Andrsn | 1951 | 15.6 | 2010 | 2004 | 1998 | 1993 | 1987 |
| Bednar/Renlund | 1952 | 16.0 | 2010 | 2004 | 1998 | 1992 | 1986 |
| Stevenson | 1955 | 17.3 | 2010 | 2003 | 1997 | 1991 | 1985 |
| Matching perceived years since Family Proclamation (1995) | |||||||
|---|---|---|---|---|---|---|---|
| Q15 member(s) | Born | prcved yrs since 1995 | Year same perceived number of years in the past for | ||||
| 10 yr old | 20 yr old | 30 yr old | 40 yr old | 50 yr old | |||
| Nelson | 1924 | 4.6 | 2014 | 2011 | 2009 | 2007 | 2005 |
| Monson | 1927 | 4.8 | 2014 | 2011 | 2009 | 2007 | 2004 |
| Ballard | 1928 | 4.9 | 2014 | 2011 | 2009 | 2006 | 2004 |
| Oaks/Hales | 1932 | 5.1 | 2013 | 2011 | 2008 | 2006 | 2003 |
| Eyring | 1933 | 5.2 | 2013 | 2011 | 2008 | 2006 | 2003 |
| Cook/Udorf/Hllnd | 1940 | 5.8 | 2013 | 2010 | 2008 | 2005 | 2002 |
| Christofferson | 1945 | 6.3 | 2013 | 2010 | 2007 | 2004 | 2001 |
| Rsbnd/Andrsn | 1951 | 7.0 | 2013 | 2009 | 2006 | 2003 | 2000 |
| Bednar/Renlund | 1952 | 7.1 | 2013 | 2009 | 2006 | 2003 | 2000 |
| Stevenson | 1955 | 7.5 | 2012 | 2009 | 2006 | 2002 | 1999 |
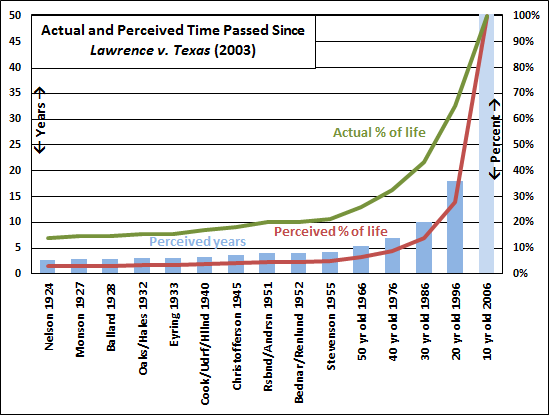
| Matching perceived years since Lawrence v. Texas (2003) | |||||||
|---|---|---|---|---|---|---|---|
| Q15 member(s) | Born | prcved yrs since 2003 | Year same perceived number of years in the past for | ||||
| 10 yr old | 20 yr old | 30 yr old | 40 yr old | 50 yr old | |||
| Nelson | 1924 | 2.7 | 2015 | 2013 | 2012 | 2010 | 2009 |
| Monson | 1927 | 2.8 | 2014 | 2013 | 2012 | 2010 | 2009 |
| Ballard | 1928 | 2.9 | 2014 | 2013 | 2012 | 2010 | 2009 |
| Oaks/Hales | 1932 | 3.0 | 2014 | 2013 | 2011 | 2010 | 2008 |
| Eyring | 1933 | 3.0 | 2014 | 2013 | 2011 | 2010 | 2008 |
| Cook/Udorf/Hllnd | 1940 | 3.4 | 2014 | 2013 | 2011 | 2009 | 2007 |
| Christofferson | 1945 | 3.6 | 2014 | 2013 | 2010 | 2009 | 2007 |
| Rsbnd/Andrsn | 1951 | 4.0 | 2014 | 2012 | 2010 | 2008 | 2006 |
| Bednar/Renlund | 1952 | 4.1 | 2014 | 2012 | 2010 | 2008 | 2006 |
| Stevenson | 1955 | 4.3 | 2014 | 2012 | 2010 | 2007 | 2005 |
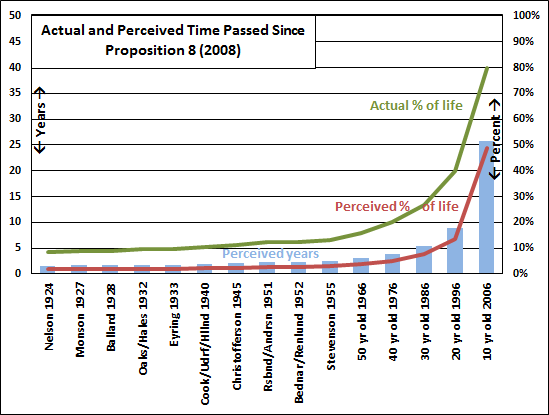
| Matching perceived years since Prop 8 (2008) | |||||||
|---|---|---|---|---|---|---|---|
| Q15 member(s) | Born | prcved yrs since 2008 | Year same perceived number of years in the past for | ||||
| 10 yr old | 20 yr old | 30 yr old | 40 yr old | 50 yr old | |||
| Nelson | 1924 | 1.6 | 2015 | 2014 | 2013 | 2013 | 2012 |
| Monson | 1927 | 1.7 | 2015 | 2014 | 2013 | 2012 | 2011 |
| Ballard | 1928 | 1.7 | 2015 | 2014 | 2013 | 2012 | 2011 |
| Oaks/Hales | 1932 | 1.8 | 2015 | 2014 | 2013 | 2012 | 2011 |
| Eyring | 1933 | 1.8 | 2015 | 2014 | 2013 | 2012 | 2011 |
| Cook/Udorf/Hllnd | 1940 | 2.0 | 2015 | 2014 | 2013 | 2012 | 2011 |
| Christofferson | 1945 | 2.1 | 2015 | 2014 | 2013 | 2011 | 2010 |
| Rsbnd/Andrsn | 1951 | 2.3 | 2015 | 2014 | 2012 | 2011 | 2010 |
| Bednar/Renlund | 1952 | 2.4 | 2015 | 2013 | 2012 | 2011 | 2010 |
| Stevenson | 1955 | 2.5 | 2015 | 2013 | 2012 | 2011 | 2009 |
I don’t blame you if your reaction to all this is to think that I’m taking this theory far too literally. I probably am. There are plenty of other explanations for why time seems to go faster as we age (for example, this article discusses some of them). And even if Janet’s theory is correct in some sense, it’s probably not exactly precisely correct at the level I’m assuming it is when I total up perceived years this way.
That being said, even if it’s only roughly right, or maybe in the realm of being right, I like how the theory highlights that events that feel long ago to younger people might feel very recent to Q15 members simply as a result of their age. This problem is probably compounded by recent social trends that move quickly in an objective sense, like the relatively fast change from a majority of Americans opposing same-sex marriage to a majority supporting it. Seeing these results does give me more sympathy for Q15 members who might feel overwhelmed at how quickly things seem to be changing. But it also makes me wish that they had some younger advisors who could help them to see that not all change is bad. Or perhaps, even better, a retirement age.
My father is 91, still active, but a lonely widower. I’m sure his days pass quite slowly, compared to a few years ago. My mother-in-law is 88 and confined to a wheelchair in a care facility but is mentally alert. Her husband passed away several years ago. I imagine her days pass very slowly. So I suspect the underlying theory here does not completely explain the perception that time passes faster as you get older. It may have more to do with how busy you are. Most of us get busier the longer we live, up to a point, and then we slow down, and so does our perception of time. Just a thought.
That’s a good point I hadn’t thought of, Wally. I read an interesting little book on time perception in general, and the author said that boredom is a reliable way of making time slow down, so we should be careful what we wish for when we want time to not go so far. I guess the effect for Q15 members would vary depending on how active they are. For those who aren’t well enough to be out and about so much, boredom might be a factor. But for the majority of them, where they seem to be constantly traveling to meetings all over the world, I wonder if their busyness might not make them feel like time is going even faster.