Change in interest in church during the pandemic part II: Members vs. non-members

I posted a few days ago about change in interest in church (in the LDS Church in particular) during the coronavirus. I used Google Trends data on searches for the Church. Commenters on the post (and on Facebook) made some excellent points about how differences might be attributable to change in interest from Mormons versus from non-Mormons. In this post, I’m going to make a quick attempt to tease that apart. (Commenters also raised other good critiques, such as that a change in Google Trends data might not reflect a difference in organic interest so much as a structural change in how church is happening during the pandemic, that are beyond the scope of what I will look at in this post.)

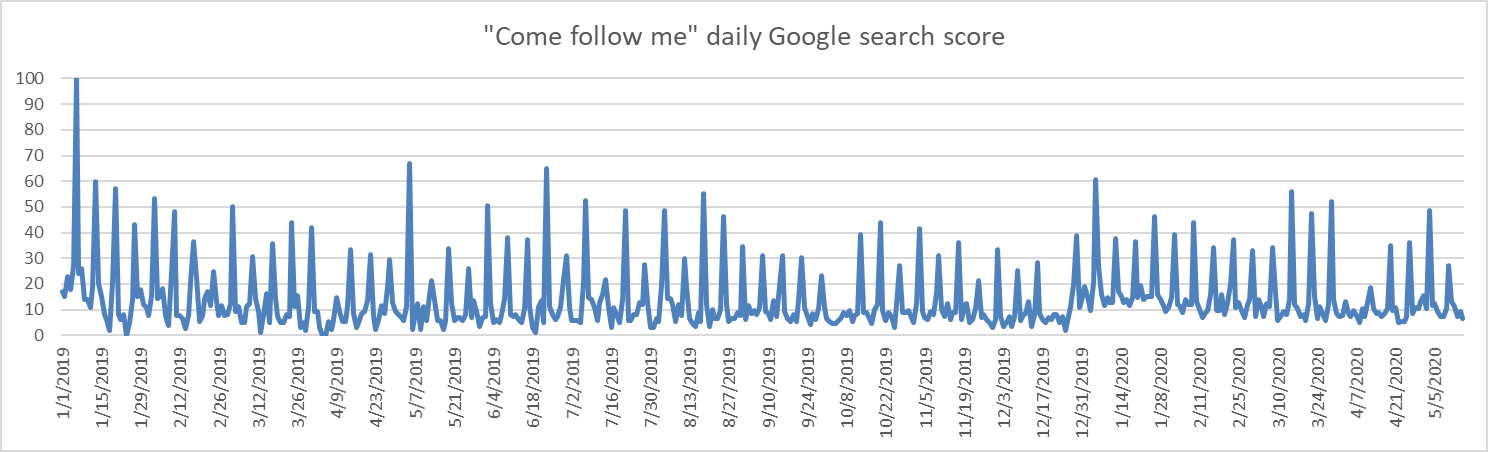
My approach is simple. Rather than looking at Google Trends data for just the Church itself, I’ll look at data for two different Mormon-related terms, one that’s more often used by Mormons, and one that’s more often used by non-Mormons. For the term more often used by Mormons, I chose “Come Follow Me,” an excellent suggestion Ardis made on my last post. Given that it’s a pretty well-known statement Jesus made in the New Testament, I wouldn’t have guessed how much its usage would be dominated by Mormons, but it clearly is. Looking at the Google Trends data, here are reasons I think it’s mostly being searched by Mormons:

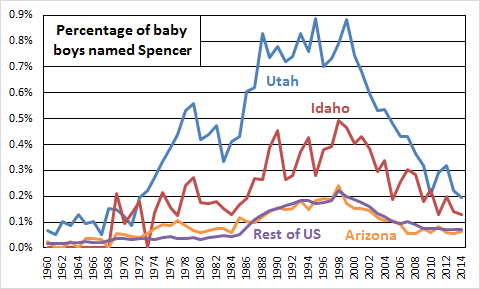
  • Search volume is the highest for the US, and within the US, for Utah, followed by Idaho.
  • There are weekly Sunday peaks that disappear on Conference weekend.
  • The top five associated search terms Google Trends suggests are all Mormon related.

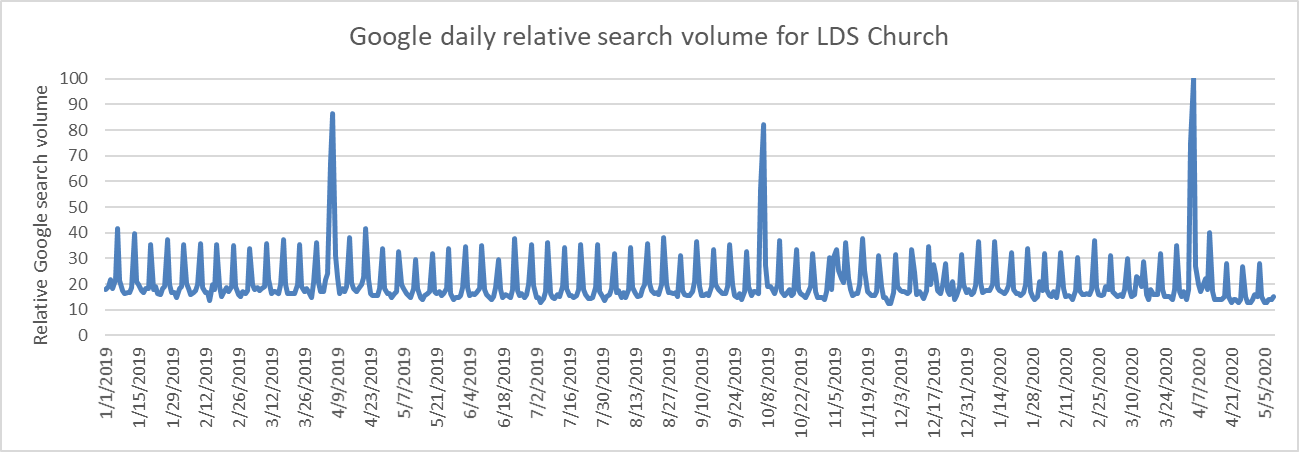
For the term more often used by non-Mormons, I’m using “Mormon,” which is ideal because President Nelson’s campaign to get us to stop saying it is clearly having an effect on people in the Church, but, not surprisingly, hasn’t been so quickly heeded by people outside the Church. As with “Come Follow Me,” the data looks consistent with the expectation of who’s using it, as the peaks are for Mormon-related news stories rather than for General Conference, when searches for the Church peak.

This graph shows daily results for “Come Follow Me” since the beginning of 2019.

Read More

Change in interest in church during the pandemic

I’ve seen the possibility floated in a number of places (e.g., in this W&T post) that when the Church resumes regular Sunday meetings, fewer people will go back than were attending regularly before the pandemic. I can certainly see the argument for this. It’s much easier to continuously keep up with a practice like weekly church attendance than to stop and start, particularly if there were already barriers making attendance difficult (distance, hearing offensive things, etc.).

I was wondering if there’s any way to forecast the degree to which this might happen by looking at what people are doing now, while not attending church. Of course this is an extremely difficult thing to measure. Not even individual wards, which typically have at least some sense of activity level from sacrament meeting attendance if nothing else, likely have much idea of what’s going on. But Google does. Google Trends tracks what people are searching for online. While this is obviously far from a perfect measure of how engage people still are with church while not attending, it might give us at least a little insight.

There are a few important things to know about Google Trends data:

  • You can get results by countries, states/provinces, and even metro areas. I wasn’t interested in geographic differences here, so everything I’ll show comes from worldwide results.
  • It doesn’t give absolute numbers–like the number of people who searched for something–but rather relative search numbers, comparing across search terms or across time for a single search term. It always gives results normed so the highest value is 100.
  • It lets you search for words (literal searches people have performed) or topics, where related searches about the same thing are aggregated. I chose to search for the topic “Church of Jesus Christ of Latter-day Saints,” because I suspect Google is smart enough to aggregate searches like “Mormon church” and “LDS church,” and also because their help says that topics aggregate across languages. I also tried a few other LDS topics, but they gave a far smaller search volume, so for this analysis, I just stuck to that single topic.
  • You can get results back to 2004 and up to a few days ago. The granularity of the data you get depends on how long a time frame you ask for. If it’s short enough, you get daily data. If it’s longer, you get weekly or monthly. I wanted daily data from January 2019. This is a long enough period that if I asked for it all at once, I got weekly data. My solution was to ask for daily data in a series of three-month periods. Unfortunately, this means that each query for a three-month period was normed to a different maximum value. In order to make the results from the different three-month periods comparable, I set them to overlap a little. By doing this, I got two results for the days that appeared in both periods, and I could use the ratio between the values given for those days in the two periods to re-norm one period so that it was comparable to the other. I used a series of re-norming steps like this to stitch together the entire daily series from January 2019 to May 2020.

The graph below shows relative search volume for the Church for the entire period.

There are two extremely clear patterns: First, there are big spikes at General Conference time. Second, there are weekly spikes every Sunday. Both of these are probably unsurprising.

Read More

A Temple-Announcing Spree

President Nelson announced eight new temples in General Conference on Sunday. This keeps up his pace from last year, when he announced 16 new temples across the two Conferences. Actual construction of all these new temples hasn’t kept up, though. Ground was broken for 11 new temples in 2019, but none have been started this year. This is why President Nelson’s spree seems to me to be more one of temple announcing than temple building. In any case, thinking about this gap between announced temples and built temples motivated me to look back at the data on the Church’s pace of the announcing, beginning construction on, and dedicating temples across the past few decades.

The graph below shows the year-by-year count of how many temples were announced, had construction begin, and were dedicated each year since 1950. I took the data from the list of temples on the Church website, and from Wikipedia where the information wasn’t available on the Church website because a temple is not yet dedicated or is being renovated.

Read More

Who bears their testimony in F&T meeting?

Who bears their testimony in fast and testimony meeting? I’m interested in this question not so much in the sense of which particular people do (“Oh, no, it’s Brother Mansplainer!”), but in the sense of whether it’s the same ten people every month or an ever-changing group.

To get some data on this question, I noted who in my ward bore their testimony in each of the 12 fast and testimony meetings in 2019. Of course it would be much better to have data from hundreds or thousands of wards and branches in different locations, but that would be really hard to get, so I decided to start with what I have. Unfortunately, I accidentally deleted data for one month when I got a new phone and factory reset the old one, so what I’m working with is 11 months of data. I excluded the testimony that’s always borne by the bishopric member who’s conducting the meeting, as I was interested in tracking testimonies borne by people who chose to do it, and bishopric members are pretty much expected to do it as a matter of course.

In the 11 F&T meetings, 99 testimonies were borne, or an average of 9 per meeting. These 99 testimonies were borne by just 44 people, so the average person who bore their testimony bore it 2.25 times in the year. The maximum number of testimonies borne by any one person was 9, and this was achieved by two people, so together they accounted for over 18% of all testimonies borne. Of the 99 testimonies, four came from visitors and two from missionaries serving in the ward.

Before I get more into the question of the same ten people, I thought it might be interesting to look at a breakdown of the testimonies by age and gender, which is shown in this graph.

Most of the testimonies (82%) were borne by adults, with some teens (age 12-17) and only one child (age < 12). Women and girls bore more testimonies in all age groups (58% of adults, 76% of teens, 100% of children).

Read More

The Selfish Gene (-ral Authority)

How often do General Authorities call their relatives to also be General Authorities? A friend asked me this question, and I thought it might be an interesting one to look at. Off the top of my head, I thought the answer would be that this happens a lot. For example, I remember President Hinckley protesting that he had nothing to do with the calling of his son as a Seventy, and I know about historical examples like Joseph and Hyrum Smith, Parley and Orson Pratt, and Bruce R. McConkie being Joseph Fielding Smith’s son-in-law.

To make the question more manageable, I decided to look only at members of the Quorum of the Twelve rather than all GAs. This includes nearly all First Presidency members too because I looked at data at the person level (meaning that each Q12 member was counted only once, versus for example looking at the composition of the Q12 each year or something like that) and nearly all FP members were also Q12 members at one point.

The first analysis I did was kind of a quick-and-dirty approach that I think is nevertheless kind of fun. I listed the last names of all Q12 members, and then checked whether each, at the time of his call, brought a new last name to the Quorum. For example, two Johnson and two Pratts were called in the original Q12, so among the four of them, they brought only two unique last names. In this analysis, I counted Smith as being a duplicate the first time it was used, given that Joseph Smith was the head of the Church, even though he wasn’t a member of the Q12.

The graph below shows, across time, the cumulative count of number of Q12 members called (blue line), and the cumulative count of unique last names for those Q12 members (red line). If every single Q12 member had a unique last name, the two lines would be on top of each other. They separate to the degree that new Q12 members have last names that duplicate last names of previous Q12 members. Note that on the horizontal axis, I separated 1835 out as its own bin, because that’s the year the original Q12 were called. After that, I grouped years into 15-year bins, which I know is a little odd, but the calling of new Q12 members is such an infrequent event that when I used 10-year bins, there were several decades with few to no new calls.


Read More

Most Viewed Conference Talks on YouTube (Part 1)

What are the most liked General Conference talks? I wrote a post a few years ago where I looked at Facebook likes of talks to see which talks got the most likes. Unfortunately, when I went back recently to update this post, I found that the Facebook like button has been removed from the General Conference talk pages on lds.org. Using the Wayback Machine, I looked at site snapshots going back a few years, and it looks like this feature was removed in March, 2016. I was lamenting this fact on Facebook when my co-blogger Katya pointed out that Conference talks are still available on YouTube, and there are like and dislike buttons.

I wrote a little script to get the counts of views, likes, and dislikes for all the talks posted at the LDS General Conference YouTube channel. This includes talks from April 1971 through April 2019 Conferences. The channel also has videos for other things like musical numbers and statistical reports, but for this post, I’m just looking at the talks.

There are a total of 3,508 talks across the 97 Conferences, given by 473 unique speakers. Just as an aside, the data needed a bit of cleaning for me to make speakers’ names consistent, as there are typos in some of their  names (for example, A. Theodore Tuttle is identified once as “A. Theodore Turtle”), as well as straight up inconsistent naming (for example, M. Russell Ballard is identified at least once using the suffix “Jr.,” but most of the time it isn’t included).

Here’s a list of the top 20 speakers who have given the most talks.

Wow! Gordon B. Hinckley and Thomas S. Monson have each given over 6% of all the talks in the sample, and each more than twice as many as any other speaker. I guess this is no surprise given how long both served not only as Church President, but also in the First Presidency. President Nelson would have to live–and be healthy enough to deliver Conference talks–for over a decade to get close to them. It’s probably Elder Bednar, who doesn’t even make this list (he’s at #23 with 29 talks) who has the best chance of joining them, as he’s likely to serve as Church President for a long time.

Read More

A Look at Crisis Text Line Data on LGBT Issues and Suicidality

Crisis Text Line is a support service for people in crisis. It’s like a suicide hotline, but more general in that the service has crisis counselors trained to respond to a broad range of crises. Also unlike a traditional suicide hotline, it’s reached by text rather than by voice. As a result of this, according to a New Yorker story from 2015 about the service, most who use it are teenagers.

Of particular interest to me, the organization also publishes aggregate data about what types of crises its clients contact them about, and from what states, as well as trends by day of the week, time of day, and across historical time (since 2015). I thought it would be interesting to look at these data to see if there were evidence of the particular stress that LGBT people are put under in Mormonism, particularly after the November 2015 exclusion policy came to light.

Unfortunately but not surprisingly, the Crisis Text Line data doesn’t include information about clients’ religious affiliation, so I’ll just use the rough approximation of using Utah data as a proxy for Mormon experience. On the up side, though, a big advantage of these data is that they summarize reports of clients’ crises by type–where I’ll just be looking at LGBT-related and suicidal thinking–rather than having only completed suicide counts to go on. Distress over one’s sexual orientation or gender identity and suicidal thinking are surely far more common than suicide itself, so these data are potentially richer than data on completed suicides alone.

Here’s a map that shows US states ranked by frequency of clients texting about issues of gender or sexual identity as a percentage of all texts received from the state. Utah ranks number seven.

Read More

References to the New Church President in Conference

In a comment here at ZD last year, Leonard R suggested that it seemed to him that speakers in Conference have become more prone recently to refer to or quote the President of the Church in their talks. Now that President Nelson has two Conferences under his belt, I thought it might be interesting to look at how often recent Church Presidents were referred to or quoted in their first two Conferences.

I used the ever-handy LDS General Conference Corpus. I looked up references to each new Church President’s last name only (to be sure I wasn’t missing any mentions where he was referred to as simply President [last name] rather than in the usual way, as our beloved prophet and leader, even President [first name middle initial last name]). Since this is just a first pass, I didn’t even check through the results to be sure I wasn’t accidentally including references to other Nelsons, Monsons, Hinckleys, etc., although I suspect that if such references do occur in the data, they are likely to be few.

Here are the results.

I’ve put an asterisk on Howard W. Hunter because he was only President for one Conference before passing away. One solution to this might have been just to double his references, but I decided against doing this because I suspect there is probably a dropoff between a new President’s first and second Conferences.

Anyway, this doesn’t actually get at Leonard R’s question terribly well because we typically have a new Church President only once a decade or so, but the trend for the last few Church Presidents certainly does look hopeful. Perhaps when I have more time, I’ll come back to this question and look at it in more detail.

Is there more temple attendance since the changes?

I’ve heard anecdotally in discussion on Facebook that people attending the temple since the changes in ordinances that came to light last week have found it much more crowded than usual. This seems like it shouldn’t be too surprising. That changes were coming was rumored at least in December, and I’m usually not the most plugged in to such things, so if I heard rumors in December, other people probably did long before that. Given the typical sameness of the temple from one visit to the next, people might be extra interested to go to see when they know it will be different. Add to that the fact that the changes may make the temple more palatable for feminists and other egalitarian-minded folks (although many also understandably feel deeply ambivalent about them), and a whole swath of people who might be on the fringes of temple attendance might want to return.

But of course what I’d love to have is some hard data to see if I can find evidence that this is really happening. Of course I don’t have actual temple attendance data, but what I do have that might serve as a very rough proxy is counts of the number of endowment sessions in each temple. I got these by looking at the individual temple pages on the Church’s site, all linked from this page that lists all the temples. Counts of sessions aren’t as good as counts of temple patrons, but the reality is that there’s zero chance that I’ll ever get anything like that, so I’ll just be happy with what I do have. Even more fortunately, I started taking monthly samples of endowment session counts in the middle of last year, so I have a little bit of past data to compare to. I haven’t counted all sessions for every day in each month, but what I have done is pick two days in each month–always a Saturday and the following Tuesday near the middle of the month–and count sessions on those days. (I chose Saturday and Tuesday because they’re the beginning and end of the temple week.)

This graph shows the total number of endowment sessions across all temples on the two sampled days for each month from April of last year to this month. (Note that the sampled days for this month haven’t even occurred yet; I’ve tried to take session counts in the week before the sampled days so I can get the most up-to-date information if the folks at the temple decide to make a late addition or deletion of a session.)

The total number of sessions looks pretty flat across time. It looks like January has a little dip from December rather than an increase. So, no evidence for the idea that temples are busier?

Not so fast! The situation is complicated by the fact that the totals are not coming from a constant set of temples. New temples open. Old temples are closed for renovation and then re-open later. Every temple (I think) is closed periodically for a few weeks at a time. This last issue means that I couldn’t just solve the problem by showing counts only for the set of temples that were open constantly through the entire period.

Read More

Do women really like Elder Uchtdorf more?

Yes. Yes they do.

Or, at least it looks like they do more on Facebook. Here’s a list of the most common patterns of likes of Q15 members by women and men. In the second row, liking Elder Uchtdorf alone is done by 6% of women but only 4% of men. The two percentage point difference (in the last column) is the largest difference for any Q15 like pattern. (Perhaps he really does need to cover up to prevent the women of the Church from sinning in their thoughts!) The pattern men have most compared to women is liking all Q15 members but the three most junior, which 2.5% of men, but only 1.3% of women do.

Read More

Family size and church leadership

This guest post comes to us courtesy of Christian N. K. Anderson.

Recently, a friend told me her bishop came up to her, touched her belly, and asked, “Sister, when are you going to bring more spirit children into the world?” In a similar vein, an Elders Quorum President recently told a different friend in a different state that it was too bad she had only three children, as he had seven and they were all successful. The five married couples in my wife’s family have so far collectively produced one child, and we routinely swap stories of being criticized or asked openly by virtual strangers to justify this state of affairs. Why does this happen so frequently?

One of the ways Jello-Belt LDS culture is increasingly out-of-step with contemporary US culture is the belief that fecundity is positively correlated with virtue. Some of this no doubt stems from over-the-pulpit exhortations that “The commandment to multiply and replenish the earth has never been rescinded” (Packer, Apr 2015, compare first paragraph of the FamProc), the fetishizing of the family (as an institution, but with vigorous legal opposition to many instantiations of LDS families), and explicit direction to have children even when financially unable to do so (Andersen, Oct 2011; quoted and enhanced in the Eternal Family Sunday School manual). This empowers people like the bishop and EQP mentioned above to feel no qualms about intruding themselves into what would otherwise be a profoundly personal decision: they are simply encouraging fellow saints to become better humans by performing the Kantian categorical morally good act of having another child (no matter the circumstances) the same way they might encourage a fellow saint to forgive an enemy or visit a sick member.

These beliefs and rhetoric are increasingly anachronistic, not just in contemporary US culture, but among LDS members, and also among the LDS leaders who continue to make these sweeping generalizations. While a 2015 lesson manual encourage teachers to express disapproval for a US fertility rate that has dropped 45% since 1960, it fails to mention that rate at which LDS members reported their children fell by 70% over a far briefer period: from 24.2 children of record per 1000 members as recently as 1982 to 7.32 in the year of the manual’s publication. It has continued to decrease to 6.62 according to the most recent April 2018 statistical report. Of course, this is tracking children of record, not total number of births; with activity dropping below 33% in the US and 15% in Central America, a large number of babies born to nominal members are likely never recorded by ward clerks. Nevertheless, I expected this underreporting to be partially offset by church growth in countries with birth rates far higher than the United States’.

Read More

That’s *President* Soares to You: Probabilities of New Q12 Members Becoming Church President

I’m so happy that I was so wrong last week when I predicted that President Nelson would call two white men from Utah to fill the openings in the Quorum of the Twelve. I’m thrilled that Elders Gong and Soares can bring some new perspectives to the Q15. And of course, one of the first things I looked up when I learned that they had been called was how old they are, because I was curious about what the chances were that either of them would make it to be Church President.

In this post, I’ve updated the simulation that I’ve run before to estimate the probabilities of each Q15 member becoming Church President. I last did this just a few months ago when President Monson passed away.  The gist of it is that I use a mortality table from the Society of Actuaries, assume that the yearly mortality probabilities apply to all members of the Q15 equally, and then run a bunch of simulations (100,000 in this case) and in each, pick a bunch of random numbers and compare them to the mortality probabilities for each member and use the comparison to work out how much longer each man would live, and the resulting way that the Presidency would be handed from one member to the next–which members would get to serve as President and which ones wouldn’t. The process is described in a little more detail in this post from 2015. Anyway, the numbers for the most senior 13 members have changed little since my post in January. What’s interesting here is the probabilities for the new Q15 members.

The table below shows the probability of each Q15 member becoming Church President, and how many years he would serve if he did. Note that if you compare carefully, you might notice some small discrepancies between this table and the one in my January post. When I was running the simulations for this post, I realized that when I ran simulations for my January post, I had calculated current age by rounding to the nearest birthday (e.g., a man who is 65 and 7 months is counted as being 66) rather than the more conventional approach of calculating it by just looking at last birthday passed. If you noticed this error in the previous post and didn’t feel the need to correct me, thank you!

Read More

Are Mormons More Homogeneous in Belief than Members of Other Churches?

Since she started attending church with the Episcopalians, I’ve heard my sister Lynnette observe that members of her new church appear to have a much broader range of beliefs than Mormons do. I guess I had never really thought about this, but if it’s true, this seems like maybe it shouldn’t be too surprising. There is lots of pressure to conform in Mormonism, all the way from scriptures that have Jesus saying “I say unto you, be one; and if ye are not one ye are not mine” to talks that exhort members to set aside the cultures they grew up in to join “the gospel culture.” And of course, this doesn’t even touch on the pressure at the local level to conform. Consider, for example, the immense backlash faced by women who participated in the “wear pants to church” actions a few years ago. They were not even going against a rule of any kind, but rather violating a norm and standing out, and this made a lot of rank-and-file members appear to lose their minds. I don’t have a very good sense of the Episcopal Church in general, but I’m guessing that, like many American Protestants, they are simply less top-down in their structure than Mormons are, so there’s more room for differences of opinion or even belief.

Really, though, what I thought would be even more interesting than reasoning out why or why not Mormons might be more homogeneous in belief than members of other churches, would be to see if there were any empirical evidence of this difference. It occurred to me that a great place to look would be the data gathered by the Pew Research Center in their Religious Landscape Study. It’s a US sample only, so it misses the larger fraction of Church membership that lives elsewhere, but it does represent the largest single concentration of Mormons in one country. I looked at Pew’s 2014 data. As these data are a few years old, they’ve already been discussed quite a bit on the Bloggernacle. I am coming at the results from a new angle, though. Rather than focusing on the particular answers respondents gave, I am interested in how similar the sets of answers are for members of the same church, regardless of what the particular answers are.

Read More

Yearly Church President Probabilities for Current Q15 Members

As a supplement to yesterday’s post, I’ve made the graph below that shows the year-to-year probabilities of each Q15 member being President.

The values come from the same mortality table that I used to run the simulation to find the likelihood of each Q15 member ever becoming Church President. This graph doesn’t require any simulation, though. For each Q15 member, I just used his yearly probabilities of survival to come up with yearly cumulative probabilities of survival (i.e., how likely is he to live through this age). Then for each Q15 member, his yearly probability of becoming President is the probability that he survives the year and that all the members senior to him do not. This is found by multiplying probabilities, so for example for Elder Ballard, who is junior only to President Nelson and Elder Oaks, his probability of being President in a particular year is this:

(Ballard cumulative probability of living)*(1 – Nelson probability of living)*(1 – Oaks probability of living)

The results look similar to what we’ve seen in the past with graphs like this, in that there are big probabilities across periods of years for Elders Oaks, Holland, and Bednar. The one big difference is that, as el oso noted yesterday, President Nelson jumped from a pretty low probability for most of his time in the quorum to 100% when President Monson died. I guess this just illustrates that applying a mortality table that gives general trends to a small group of people as I have here is bound to be wrong in big ways at times.


Church President Probability Changes with President Monson’s Death

As you are no doubt aware, President Monson passed away Tuesday evening. As I have before when a member of the Q15 passes away, in this post I’ll show how the probabilities of becoming Church President change for the other members as a result.

All the probabilities come from a simulation I did for a post back in 2015. It’s a straightforward simulation: it uses an actuarial table and each Q15 member’s age and seniority in the quorum as inputs, and it draws a series of random numbers to simulate different possible life expectancies for each member. The life expectancies are then compared to find in what fraction of the simulations each member outlives all other members senior to him to become President. I did 100,000 replications for each run. That is, 100,000 times I drew random numbers for each Q15 member and compared them to his survival probability each year, and then worked out whether each member would become President or not in that scenario, and how many years he would serve if he did. For a more detailed description of the process, see my earlier post.

I realized when writing this post up that I had never done a post to show changes in the probabilities after Elder Hales passed away last October. I’ll start with that. This table shows the changes in probabilities and average number of years serving as President for the other Q15 members after Elder Hales died. Note that all the numbers, including ages, are as of October, 2017.

Read More

What fraction of missionaries are sisters?

It has been five years since President Monson announced the change in minimum ages at which missionaries can serve. It’s clear that much of the increase in the number of missionaries that followed that announcement came from an increase in how many women were choosing to serve. For example, a 2015 ABC News article on sister missionaries reports (I assume quoting a Church spokesperson) that there were 22,000 sister missionaries at the time, that they made up more than a quarter of all missionaries, and that their numbers had nearly tripled since the age change was announced. Along similar lines, a Deseret News article from one year after the age change reports that there had been increases of 10,000 elders and 11,000 sisters in the previous year. There’s also a Deseret News article from 2014 that gives actual percentage breakdowns: 64% single men, 28% single women, and 8% senior couples.

This increase matches my anecdotal experience. I haven’t tracked anything systematically, but just from following friends on Facebook, it seems like a lot more families who I would have thought were pretty conventionally Mormon have sent daughters on missions in the past few years than did before. I note that they’re conventional because my impression is that having women serve missions before the age change always seemed to me to be a little out of the norm. Like the thinking was that it was a nice thing to do and all, but really shouldn’t women be getting married instead?

It’s great that the news articles I mentioned give some point-in-time snapshots of how many women are serving missions, but what I’m really interested to know is what the trend over time is. For example, I wonder if the number of women serving increased suddenly right after the age change, but then leveled off. Or perhaps it increased at that time, and has continued to increase since then. Or maybe there was a temporary spike and then the number of women serving have decreased.

Like with so many other questions about Church-related data, I’m sure the numbers are available somewhere in the COB, but I’m never going to get to see them. So I did the next best thing and gathered a little data from what I could find. I considered possibilities like counting women and men in missionary alumni Facebook groups, or on a website like LDSMissions.com that allows returned missionaries to register and join a group of others who served in the same mission (although it doesn’t look like the site has been updated in a while). I ended up, though, choosing to gather data from MyMission.com, though, for a couple of reasons. First, it has lists of links to missionary blogs in a nice standard format that was relatively easy to grab. Second, it has missionaries listed as “Sister” or “Elder,” so I didn’t have to make any assumptions about whether someone with a particular first name was female or male.

Read More

Book of Mormon people’s names my parents give to me!

In my last post, I looked at how often children in Utah, Idaho, and Arizona are named after the current Church President. I thought it also might be interesting to look at how often children are named after people in the Book of Mormon. One advantage of looking at Book of Mormon names is that it doesn’t require me to limit myself to states with lots of Mormons. If you’re naming your child Nephi, you’re probably Mormon, regardless of where you live. The downside, of course, is that this rules out names that are not unique to the Book of Mormon. For example, someone naming their child Benjamin may be thinking of the Book of Mormon king, but there are many other Benjamins out there that their choice was more likely inspired by.

Because using a Book of Mormon name is a clear marker of Mormonness, there’s even good reason to have a hypothesis beforehand about what the data will look like. In The Angel and the Beehive, Armand Mauss talks about the Church’s shift between the 1960s and 1990s from leaning toward assimilation with the broader world, toward more retrenchment. I think it would make sense to expect that Mormons would use more distinctly Mormon names during a period of retrenchment, when drawing bright lines between the Church and the world is an important practice, than during a period of assimilation. Therefore, I expected to see increasing usage of Book of Mormon names between the 1960s and 1990s.

I got data from the same sources as I did for my last post: the Social Security Administration (SSA) name database for counts of how often names are used by state and year from 1960 to 2014, and CDC Vital Statistics reports for counts of total births by state and year for the same time period. Here is an alphabetical list of the Book of Mormon names I checked:

Abinadi, Abish, Helaman, Jarom, Lehi, Limhi, Mahonri, Mormon, Moroni, Mosiah, Nephi, Omni, Sariah, Teancum, Zeniff

I looked at the girls’ names first: Abish and Sariah. Unfortunately, Abish only shows up in three of the years (1999, 2000, and 2003). The SSA database doesn’t report counts of less than five (for either a state or the entire country), so it’s likely that the name was used in other years, but just fewer than five times. For Sariah, I ran into a different problem. I thought it was a uniquely Book of Mormon name, but while the SSA data shows elevated levels of usage in Utah, Idaho, and Arizona, the name also appears in lots of other states. Overall, Utah, Idaho, and Arizona account for only 11% of uses of the name. I wonder if it isn’t being used by people not referring to the Book of Mormon as an alternative spelling of Saria or another takeoff on Sara(h). In any case, given that the name doesn’t appear to be an indicator of Mormonness, I put it in the non-unique bin with names like Benjamin.

For three of the boys’ names, I found no hits at all: Limhi, Mormon, and Zeniff. Because of the reporting threshold of five, this doesn’t mean these names are never used, but if they are, it’s clearly very rare.

The remainder of my analysis looks at just the remaining ten names. Here’s a graph showing how often they are used in the full US data.

To me, the big surprise here is Jarom. I would never have guessed that it would be used most among the list of names I started with. I included it kind of as an afterthought, since he’s such a minor character.

Read More

Follow the Prophet(‘s Name)

Do Mormons name our kids after the current Church President? I’ve known some people who have (or at least I’m assuming that was their inspiration–Hinckley seems like an unusual name to use for any other reason), but I wondered if it was a more general phenomenon.

Unfortunately, I don’t have Mormon-specific naming data, nor do I have data from outside the US. What I do have is the Social Security name database, which gives yearly counts of names used by state. So I thought it might be interesting to at least look at whether states with lots of Mormons use names of Church Presidents more often than other US states, especially starting around the time a Church President is called. I assembled the name data and the yearly birth count data from the CDC’s Vital Statistics reports as described in this post from last year. As in that post, I got data for the years 1960 through 2014.

I checked the first and last names of all Church Presidents since David O. McKay, although as he became Church President in 1951, I couldn’t check whether there was a change at that time. I compared the percentage of babies given those names in Utah, Idaho, and Arizona, and also the percentage in the rest of the US. The Social Security data reports counts separately for girls and boys, so I checked each name for both.  For nearly all the Presidents’ names, I couldn’t see any evidence of the pattern I was looking for. Either the states with lots of Mormons used the name less than the rest of the country, or they hardly used the name at all, or there was no change around the time the President having the name was called.

There are three exceptions, where there is at least a hint that something is going on. All (not surprisingly) are for boys. The names are Spencer (W. Kimball), (Howard W.) Hunter, and Thomas (S. Monson). Here is the graph for Spencer.

Read More