Thanks to the handy LDS Scripture Citation Index (LDSSCI), it’s easy to get data to answer this question. I looked up each of the current members of the Quorum of 15 to see how often he cited the Old Testament, New Testament, Book of Mormon, Doctrine and Covenants, and Pearl of Great Price in his Conference talks. For example, for President Monson, the counts are 332, 818, 184, 255, and 32, respectively. Here are counts for all Quorum members:
| Counts |
| Member |
OT |
NT |
BoM |
D&C |
PGP |
Total |
| Monson |
332 |
818 |
184 |
255 |
32 |
1621 |
| Packer |
125 |
312 |
559 |
470 |
96 |
1562 |
| Perry |
95 |
116 |
141 |
106 |
74 |
532 |
| Nelson |
399 |
695 |
910 |
945 |
209 |
3158 |
| Oaks |
149 |
538 |
504 |
386 |
60 |
1637 |
| Ballard |
26 |
139 |
133 |
111 |
32 |
441 |
| Scott |
25 |
57 |
203 |
144 |
34 |
463 |
| Hales |
77 |
336 |
291 |
187 |
78 |
969 |
| Holland |
70 |
243 |
140 |
74 |
24 |
551 |
| Eyring |
27 |
97 |
162 |
135 |
16 |
437 |
| Uchtdorf |
56 |
166 |
126 |
121 |
28 |
497 |
| Bednar |
19 |
60 |
148 |
87 |
15 |
329 |
| Cook |
27 |
57 |
73 |
82 |
9 |
248 |
| Christofferson |
11 |
129 |
139 |
118 |
26 |
423 |
| Andersen |
17 |
98 |
102 |
59 |
11 |
287 |
Next, to adjust for the fact that Quorum members differ in the total number of scripture citations they put in their talks, I converted the counts of citations to percentages of all citations by the member. Using President Monson as an example again, this means dividing each of his counts by book (332, 818, 184, 255, and 32) by his total (1621) to get his percentages. Here are percentages for all Quorum members:
| Percentages |
| Member |
OT |
NT |
BoM |
D&C |
PGP |
| Monson |
20% |
50% |
11% |
16% |
2% |
| Packer |
8% |
20% |
36% |
30% |
6% |
| Perry |
18% |
22% |
27% |
20% |
14% |
| Nelson |
13% |
22% |
29% |
30% |
7% |
| Oaks |
9% |
33% |
31% |
24% |
4% |
| Ballard |
6% |
32% |
30% |
25% |
7% |
| Scott |
5% |
12% |
44% |
31% |
7% |
| Hales |
8% |
35% |
30% |
19% |
8% |
| Holland |
13% |
44% |
25% |
13% |
4% |
| Eyring |
6% |
22% |
37% |
31% |
4% |
| Uchtdorf |
11% |
33% |
25% |
24% |
6% |
| Bednar |
6% |
18% |
45% |
26% |
5% |
| Cook |
11% |
23% |
29% |
33% |
4% |
| Christofferson |
3% |
30% |
33% |
28% |
6% |
| Andersen |
6% |
34% |
36% |
21% |
4% |
(Note that the percentages do not add to 100 for some members because of rounding.)
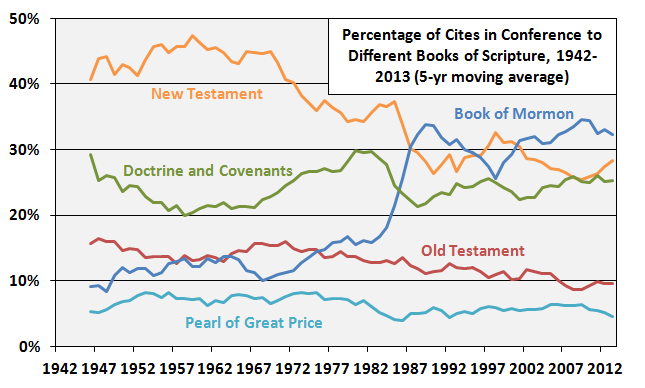
Finally, I did one more adjustment to account for the norms of how often the different books of scripture are cited in Conference by all speakers during the years each Quorum member served. What I mean here is that at different points in time, different books of scripture were cited more or less by all speakers in Conference. Because members have been in the Quorum for different amounts of time, some of the differences between them can be accounted for by the different norms in Conference at the times they were giving talks.
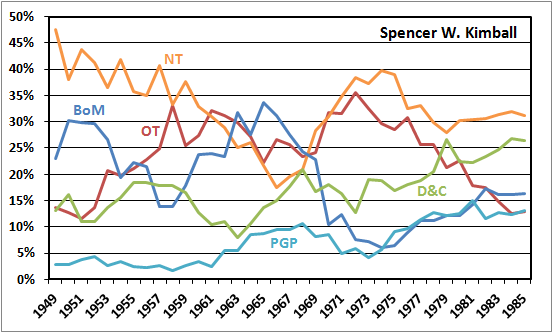
The biggest shift in the time current Quorum members have served has been an increase in citations of the Book of Mormon. Here’s a graph showing the percentage of all citations of scriptures in Conference that came from each of the five books of scripture since 1942 (as far back as the LDSSCI has Conference talk data).
 Read More
