In Clark G. Gilbert’s April Conference talk, he referred to Ryan Burge’s Substack Graphs About Religion. Gilbert (see his note 11) was talking about people still being concerned with meaning and purpose in life even after leaving religion. Now, though, Burge has a post up that I’m quite sure will not be referred to in Conference, titled “The LDS Church Has a Retention Problem.” (Although it has already gotten a defensive response from a BYU professor in the Deseret News.)
Burge uses Pew Religious Landscape Study data to compare retention among Mormons and other religious groups and finds Mormons score poorly. He has a lot of interesting things to say in his post, and I definitely recommend you go read the whole thing if it sounds at all interesting. I wanted to focus on just one point he made, though, which is that Mormon retention is lower among younger people. Here’s one of his charts:
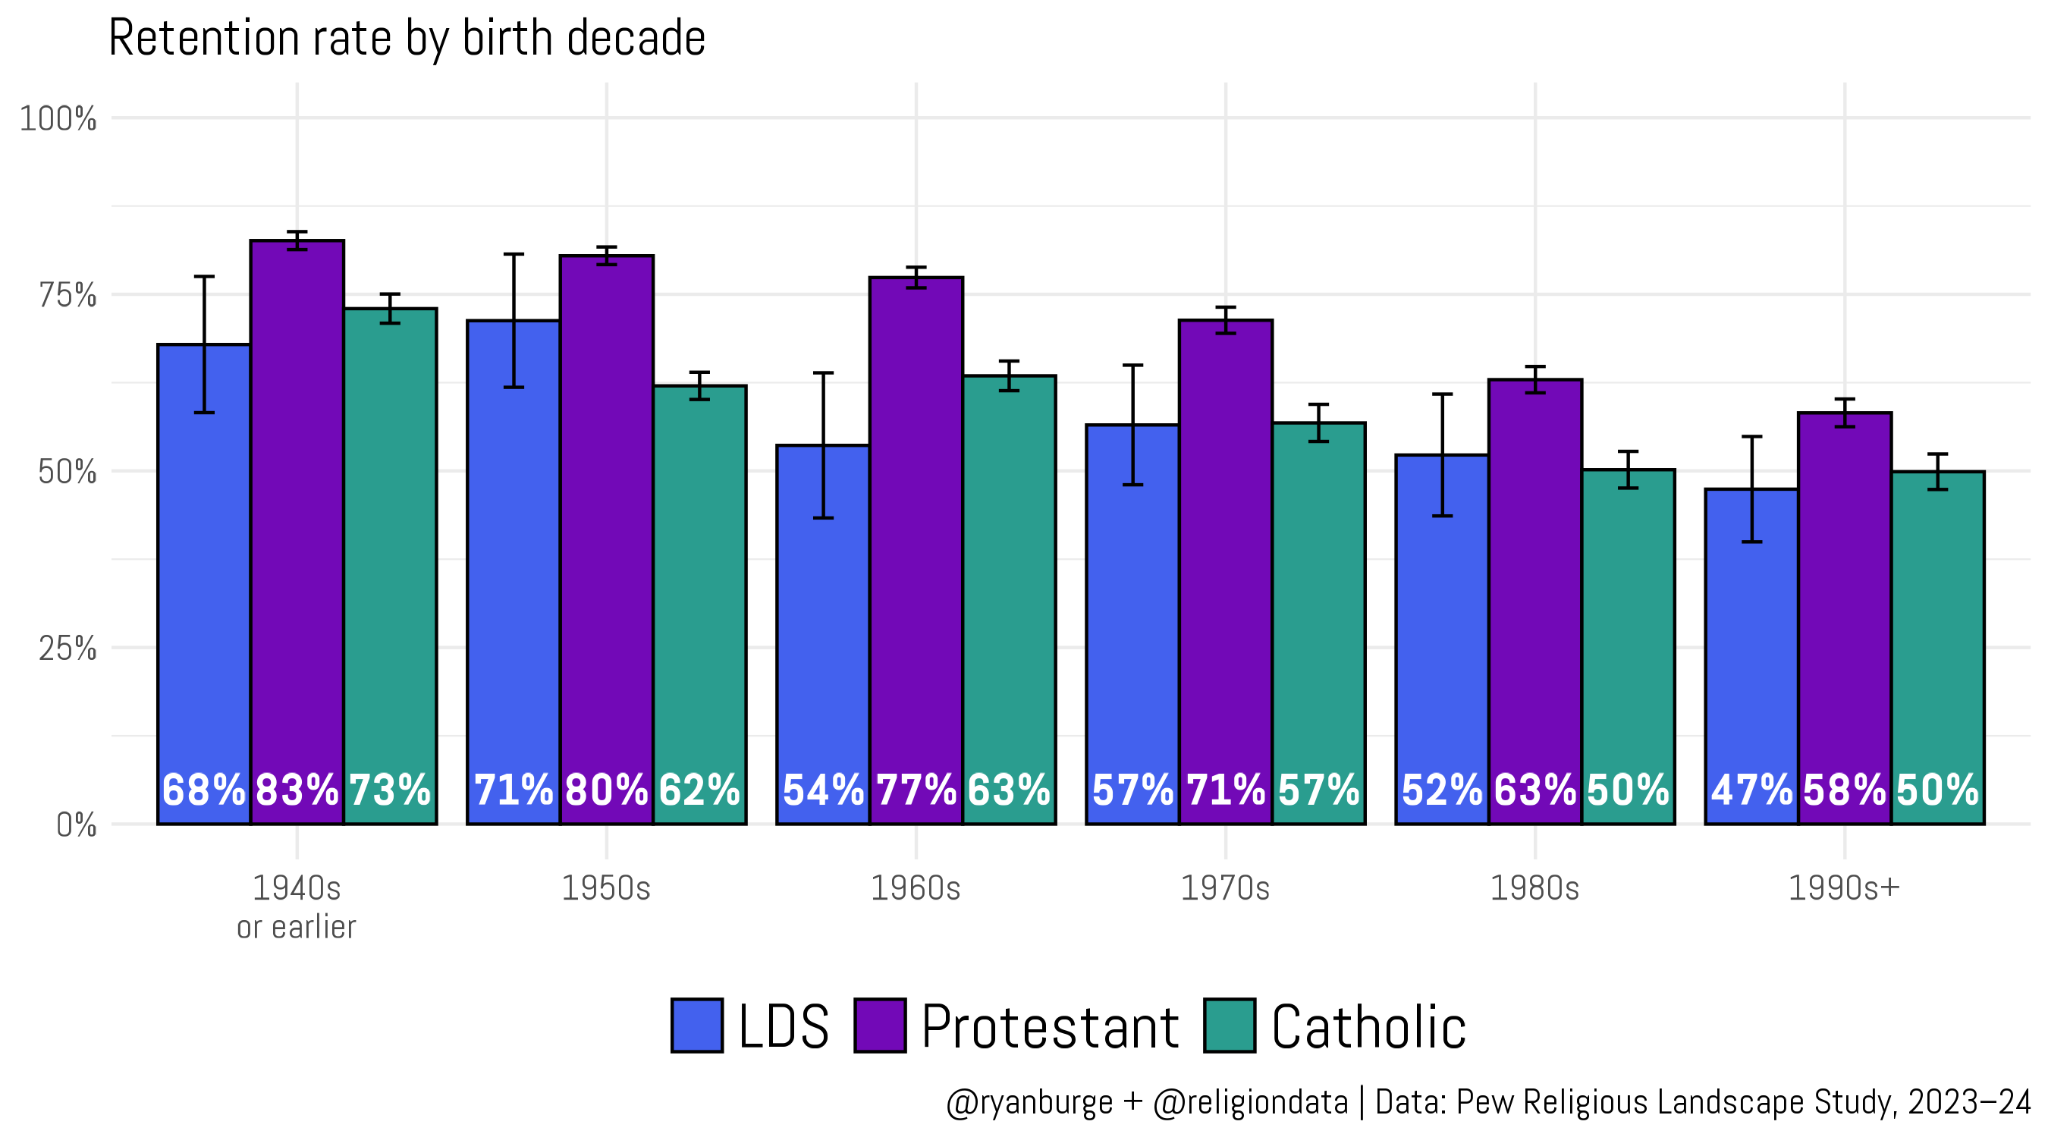
As you can see, retention is lower among younger people, as Burge discusses. But what I find striking is that this comparison actually understates the retention problem. The oldest respondents have had far more years of adulthood, far more opportunities to leave, but they still have higher retention rates than the younger respondents do after far fewer years.
Here’s a reworking of just the Mormon data from the chart above. I took the midpoint of each decade cohort (i.e., 1945 for 1940s or earlier, 1955 for 1950s, etc.) and calculated age in 2023, which is the starting year of the Religious Landscape Study.
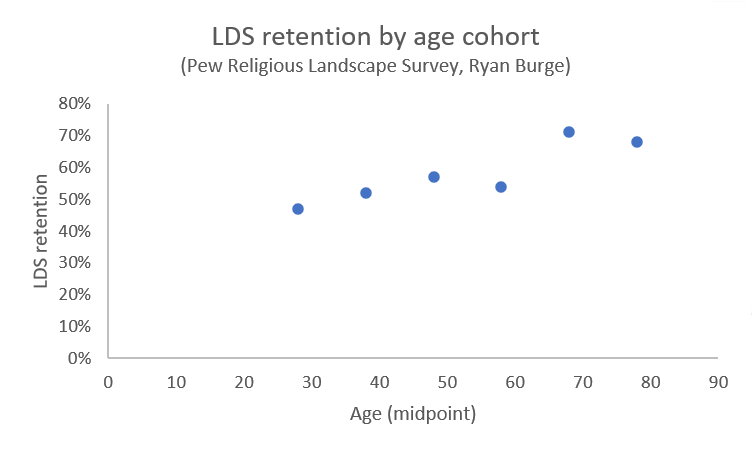
If there were a similar exit rate for each of the cohorts, the pattern in the scatterplot would go down to the right, as the older cohorts that have had more time to leave would have had more people leave. (I admit here that I’m assuming a situation where people who leave hardly ever come back, although I admit it does occasionally happen, in stories often trumpeted in Conference.) But instead, the pattern goes up to the right, showing younger people having left at a far faster rate than older people.
Here’s one other way to look at the question, and a crude way to quantify it. In the table below, for each age cohort, I figured out what constant yearly loss rate would lead to the observed total loss rate for each age cohort. For example, for the oldest group, the midpoint age in 2023 is 78 (2023 – 1945). With a 68% retention rate, this means 32% have left. For simplicity, I assumed leaving starts at age 18. Then I found the yearly loss rate that would be required to yield a 32% loss rate after 60 years (78 – 18). This turns out to be 0.64%. This just means that (1 – 0.64%)60 = 68%, or in other words, if you reduce the starting number by 0.64% each year for 60 years, you end up with 68% of your starting number remaining. Here’s a table with the same calculation for each age cohort.
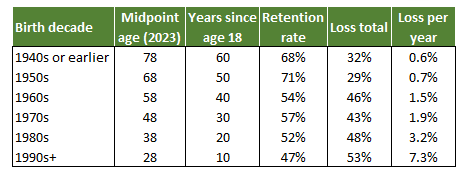
The yearly loss goes from well under 1% for the 1940s and 1950s cohorts to between 1% and 2% for the 1960s and 1970s cohorts to nearly doubling from the 1970s to the 1980s cohorts to more than doubling from the 1980s to 1990s cohorts. There are a lot of caveats: if you look at Burge’s original chart, the LDS error bars are wide because the LDS samples are small. I’m only showing loss per year estimates to a tenth of a percent in the table above because it’s needed to distinguish the values for the oldest cohorts. Of course these values have lots of error in them and are nothing like as precise as I’m showing. And like as always with Pew data, it’s the US only. But even given all this, I find the conclusion striking: the Church appears to be doing a really poor job of retaining American members born in the 1980s and later.
What do you think explains the drop in the 1960s portion? Do you think it had to do with younger members upset regarding civil rights and the race ban?
As always, Ziff, I am impressed by your postings. Thank you.
Vic: This could very well be noise in the data. Burge mentions that this all hinges on 703 total responses. So each of these decennial groups is only about 120 people. And that’s not a ton of data to be very confident that retention rates for those from the 60s is really that dramatically different than for those born in the 50s.
I also want to point out that for the youngest group (90s+), it might actually be even worse that Ziff’s table shows. For the 80s group, he’s representing people ages 33 to 43 and treating them all as if they are 38. A simplification to be sure (as he acknowledged), but I think a reasonable one for generating a rough estimate. But for the 90s+ group, there’s that tricky little ‘+’ on there. Some of the respondents may have been born in the 2000s. So that group probably isn’t 23 to 33, but 18 to 33. (I’m guessing they didn’t survey minors.) I have no idea if the respondents are evenly spread through that range, but with such a low number of years, that would have a very large effect on the numbers. If, instead of having 10 years since 18 to have left they’ve only had 7.5, this would shift the loss per year from 7.3% to 9.6%. The math for the youngest group is really sensitive to the number of years, because 2 years out of 10 is a big change. Whether those old folks have had 50 or 52 or 48 years to remain active isn’t nearly so impactful.
It’s not really about whether any specific number here is particularly accurate, but that it is yet more evidence that the problem of retention is particularly bad among younger groups.
Vic, if those numbers hold across a larger sample, there are a few other issues that could have driven higher numbers out during the 1960s in addition to the racial problems. It was the era of the hippies, drugs, long hair and short skirts and other youth problems that drove our church elders mad. The harder the church tried to crackdown on silly things like long (to their eyebrow) hair and sideburns, the more youth they drove out. There were real issues, like race relations and the war in Vietnam and we heard pulpit pounding about 1/4 inch too long of hair or skirt hems being one inch from the floor when they made us kneel on the ground to test obedience. We got lecture on white shirts and the evils of rock music, when we needed real guidance on issues that mattered, not stricter dress standards. It not only made church unwelcoming, but made the church look very superficial. By the 80s, the church realized they were losing some of the youth and eased off the strong conformity pressure. My uneducated guess would be that the dip in retention was real having lived through that time as a young person.
Ziff, are you going to discuss the fact that it is more the young women who are leaving than even the young men. My granddaughters are already in the “have left” group at 18 and 16. Grandsons are more on the fence still, unhappy enough with the church that the oldest refused missions, but not as hostile and out as the girls.
So, if the chart above were extended, (hypothetically- following the trend) would that mean we have about 26 years (till 2052) until we have a 100% annual loss rate? And about until 2090 (64 years) until we have a less than 5% retention rate?
it’d be good to put this in general context because these are general trends.
the world has a problem, not just the church. religion still has great value in society (as per research) but is being treated as tho it’s something to be avoided.
Mortimer,
Your extrapolations are probably just as accurate as those of (nonmember) Rodney Stark in 1984, when he suggested that the Church could have 267 million members by 2080.
I recently listened to a family group of well-educated professional women, mostly devout, who represent a full spectrum from the youngest boomer (63) through Gen Z. Their discussion was lively, but their conclusions were that most of their past active LDS friends were out or on the threshold, and two causes were a blatant disregard for the concerns and needs of women, and the realization that the church was retreating from problems they saw in their everyday lives (child care, youth programs, education, poverty, etc.).
My point in mentioning this is not to agree with these women (although I do). The point is that previous demographic shifts were not common knowledge or were wildly optimistic (like Stark’s). This trend is being discussed and analyzed by LDS women who know they have little access to the ears of leadership in Salt Lake. These are powerful, successful women who feel powerless in only one aspect of their lives: church. And they are talking about it in family and church settings. Rodney Stark’s surveys and analysis had positive effect on the attitudes of average members. These numbers do not and they also reflect a lived reality. Their friends. family members, children and grandchildren are leaving. And that has to affect their views of the future.
I believe that these numbers may partly be responsible for future changes in LDS culture, changes that are not under the control of the hierarchy in Salt Lake. Changes that Salt Lake may not like. Failing to listen can go both ways.