I thought this might be an interesting question because if ever people are going to be inspired to want to go to the temple, you’d think it would be during Conference. Sister or Elder So-and-So gives an inspiring talk about temple work, and even though temples are of course closed during Conference, it’s easy while watching or listening to just whip out your phone or computer and make a temple appointment.
I looked at this question using the Church’s same handy online temple appointment scheduler that you’d use to make an appointment. Helpfully, it reports the number of seats available for a proxy ordinance session, so it was straightforward for me to check the number of seats available before Conference weekend, and then again afterward. For comparison with Conference weekend, I also checked the change in number of seats available across the four weekends around Conference weekend, two before, and two after.
Because it was still a bit laborious for me to gather the data, I reduced the sample in several ways:
- I looked only at endowment sessions (because they’re the most time-consuming of temple ordinances).
- I looked at only sessions for the week following the weekend I was checking. For example, for Conference weekend, which was April 1st-2nd, I looked at sessions for Tuesday April 4th through Saturday April 8th. (Most temples are closed on Mondays. The exceptions I’ve found are Aba Nigeria and Provo Utah, but I excluded the few sessions on Mondays for these temples.)
- I looked at only a sample of open temples. I chose them by region, to try to be at least kind of representative of the areas where the Church has temples. Within each region, I chose the temple that appeared to generally offer the most endowment sessions, because I figured more sessions would give more data and more chance to find an effect.
- For each session, I checked its available seat count just twice, once on the Friday evening before the weekend, and again on the Monday evening after the weekend. (Note that for a few temples in the Pacific and therefore many time zones ahead of me in the US, I checked their counts in mornings instead, to be sure that I wasn’t checking so late on Monday that some of their Tuesday sessions had already begun.)
In addition to the worldwide sample of temples, I was also in the middle of gathering data for another project on all temples in Utah, so I was able to include them as well. The temples outside Utah in the sample are the following: Aba Nigeria, Boise Idaho, Campinas Brazil, Chicago Illinois, Dallas Texas, Guatemala City Guatemala, Hamilton New Zealand, Lima Peru, Madrid Spain, Manila Philippines, Mesa Arizona, Mexico City Mexico, Nuku’alofa Tonga, Orlando Florida, Preston England, Seattle Washington, and Washington D.C. The open Utah temples are the following: Bountiful, Brigham City, Cedar City, Draper, Jordan River, Logan, Monticello, Mount Timpanogos, Ogden, Oquirrh Mountain, Payson, Provo City Center, Provo, and Vernal.
This graph shows results for non-Utah temples. The bars show the average change in number of available seats per endowment session between Friday and Monday (again, the actual sessions are the following Tuesday through Saturday). For each temple, the left bar shows the average change across the two weekends before Conference, the middle bar shows the average change across Conference weekend, and the right bar shows the average change across the two weekends after Conference. The lines that point up and down from the top of each bar and end in short horizontal lines are standard errors. (If you don’t want to read some statsy explanation at the link, you can just think of them as a measure of reliability: if these are small, we have more confidence that the true average change is close to the bar height, and if they’re big, we have less confidence.) Where I’ve shaded in the before-Conference or after-Conference bars, this means that they’re statistically significantly different from the Conference bar for the same temple. (The specific statistical test I used was a t-test, two tailed, meaning it looks for differences in either direction–bigger or smaller.)
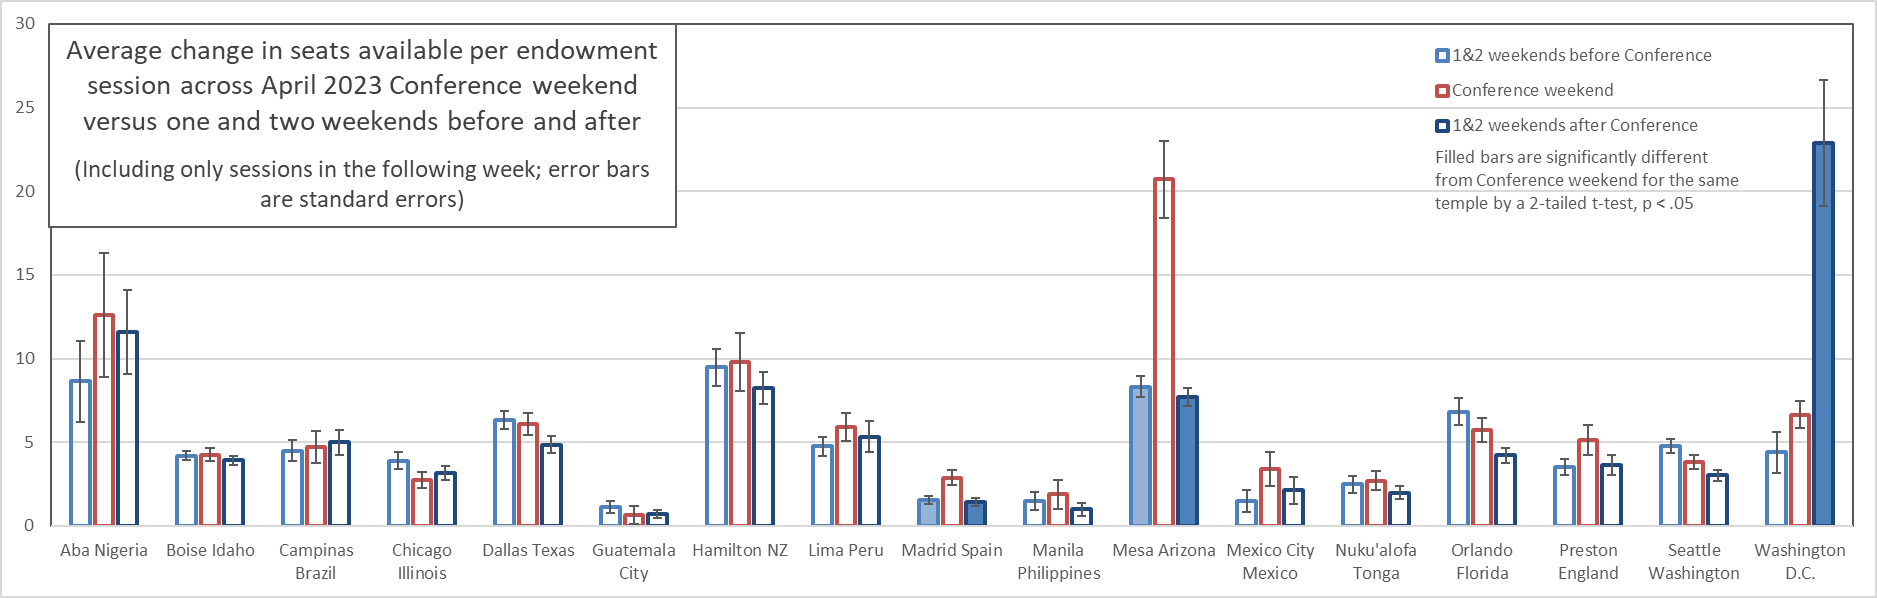
As you can see, the pattern I was expecting, of more change in available seats occurring during Conference weekend, only shows up as statistically significant for two of the 17 temples: Madrid Spain and Mesa Arizona. If we set aside statistical significance, eight other temples at least have higher average changes during Conference weekend than in weekends before or after. It’s maybe some evidence for increased temple scheduling during Conference, but if so, it’s pretty weak and clearly not consistent.
You probably also noticed that Washington D.C. has this strange pattern where change in available seats was far higher in weekends after Conference then either before or during Conference. What happened here is that the powers that be at the temple moved some of the sessions’ times around between when I checked the available seats on Friday and when I checked them on Monday. In the data for the graph, I excluded any sessions from either day that I had no match for on the other day. The effect may have been that some sessions were consolidated together, and this may be why the number of available seats went down so drastically. In any case, it seems pretty clear that the high value for Washington D.C. after Conference is an artifact of schedule tinkering rather than evidence of sudden greater enthusiasm for making temple appointments.
One other issue with this analysis is that in some cases, sessions were already nearly or entirely full when I checked on Friday, so they had little to no room to change over the weekend. This was particularly an issue for Guatemala City. Rather than trying to come up with an elegant solution to account for it, I simply re-summarized the data, but included only sessions that had at least ten open seats when I checked on Friday before the weekend. The results changed a little, but not a whole lot. There were three new statistically significant differences: both before-Conference weekends and after-Conference weekends versus Conference weekend for Lima Peru, and after-Conference weekends versus Conference weekend for Hamilton New Zealand.
This graph shows results for Utah temples. Again, the bars show average change in number of available seats across the weekend for the following week, the lines pointing up and down are standard errors, and the filled bars are statistically significantly different from Conference weekend by a t-test.
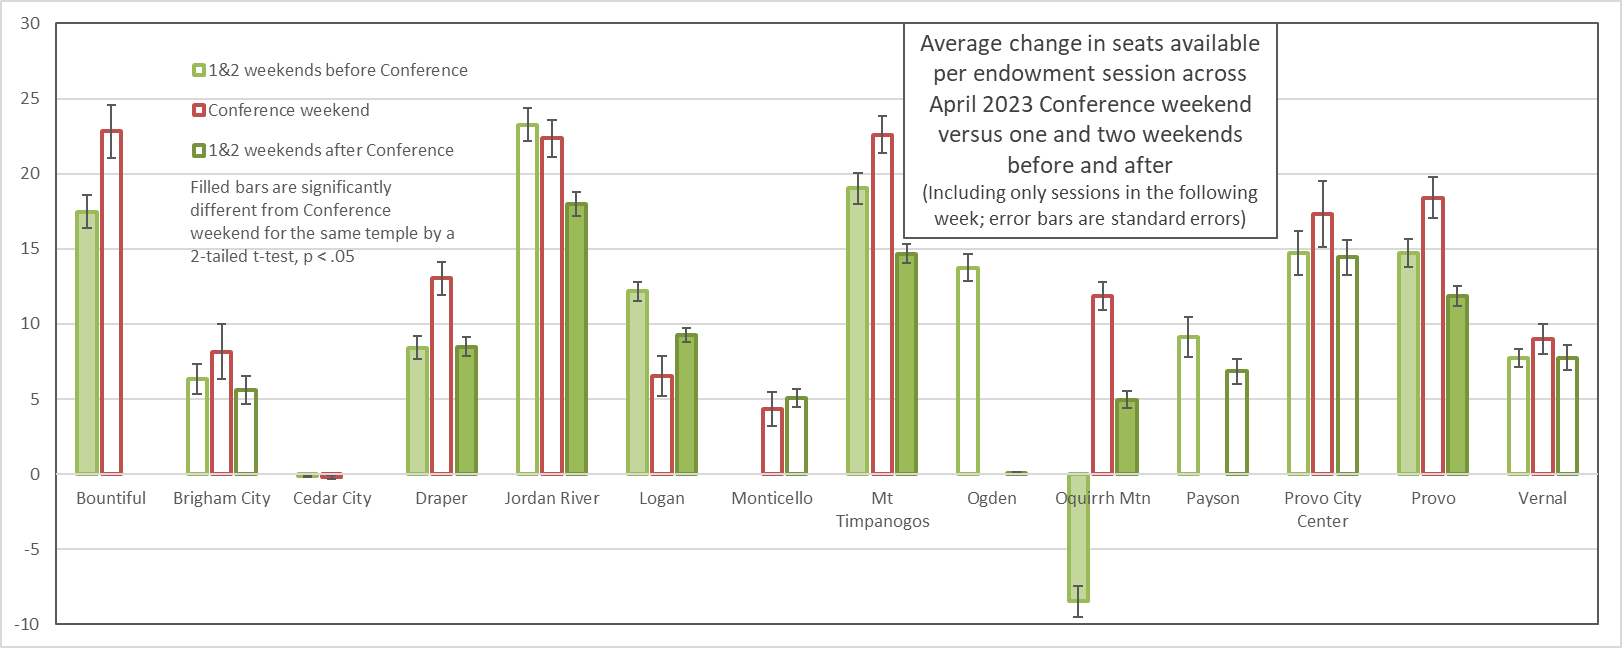
There’s extra messiness here that isn’t present in the non-Utah data. First, several temples had periodic temporary closures for maintenance, so some of the bars are entirely missing (e.g., Bountiful after Conference, Ogden during Conference). Then there’s Oquirrh Mountain with its strange negative bar, meaning that across weekends before Conference, the number of available seats for endowment sessions in the following week actually went up! What I think is going on here is that Oquirrh Mountain has been running pretty close to capacity, so sessions frequently have few-to-no available seats. Then it was closed from March 13th to the 27th (meaning the before-Conference bar represents just one week of data rather than the usual two), and demand piled up. Patrons filled up all available appointments for when it was to re-open. But then when it actually did re-open, some of them canceled their appointments, which were likely taken up by other patrons, but just not immediately. With the sessions for the following week being pretty much full when I checked Friday, the only possible change I could observe on Monday was that some of the seats had been freed up. There was no room for a net increase in appointments. (If anyone who’s reading attends this temple, I’d love to hear your perspective on whether my explanation is reasonable.)
But getting to my main question, it looks like Draper, Mount Timpanogos, Oquirrh Mountain, and Provo have statistically significantly larger changes in available seats across Conference weekend than the surrounding weekends. In addition, Bountiful and Jordan River have statistically significant differences for either before or after, but not both. But also note that Logan’s result is completely the opposite of my expectation: the decline in available seats was larger in both before-Conference and after-Conference weekends than during Conference weekend.
Utah temples also have an issue that isn’t relevant for most other temples, other than perhaps a few in Idaho and Arizona: if one is full, you can easily just go to another one that’s nearby. This means that some of the changes in number of seats scheduled may be attributable to whether nearby temples are full or closed rather than to a change in interest because of Conference. For example, Oquirrh Mountain and Jordan River are four miles apart. It seems possible that Jordan River’s decline from before Conference to Conference, and then from Conference to after Conference, might be attributable to Oquirrh Mountain opening back up on March 28th and taking up some of the demand that Jordan River had been absorbing while it was closed. Or Payson was closed right around Conference. Is this part of the reason that both Provo (21 miles away) and Provo City Center (19 miles) had increased average change in available seats at the same time? It seems to me that at least some of this kind of temple demand shifting must be going on, but I’d have to gather more data, especially across more time and more temple closures, to come up with a good answer.
For the Utah temples, I also did the same re-summary of the data including only sessions that had at least 10 open seats when I checked on Friday. Here the result is different enough that I made a separate graph to show.
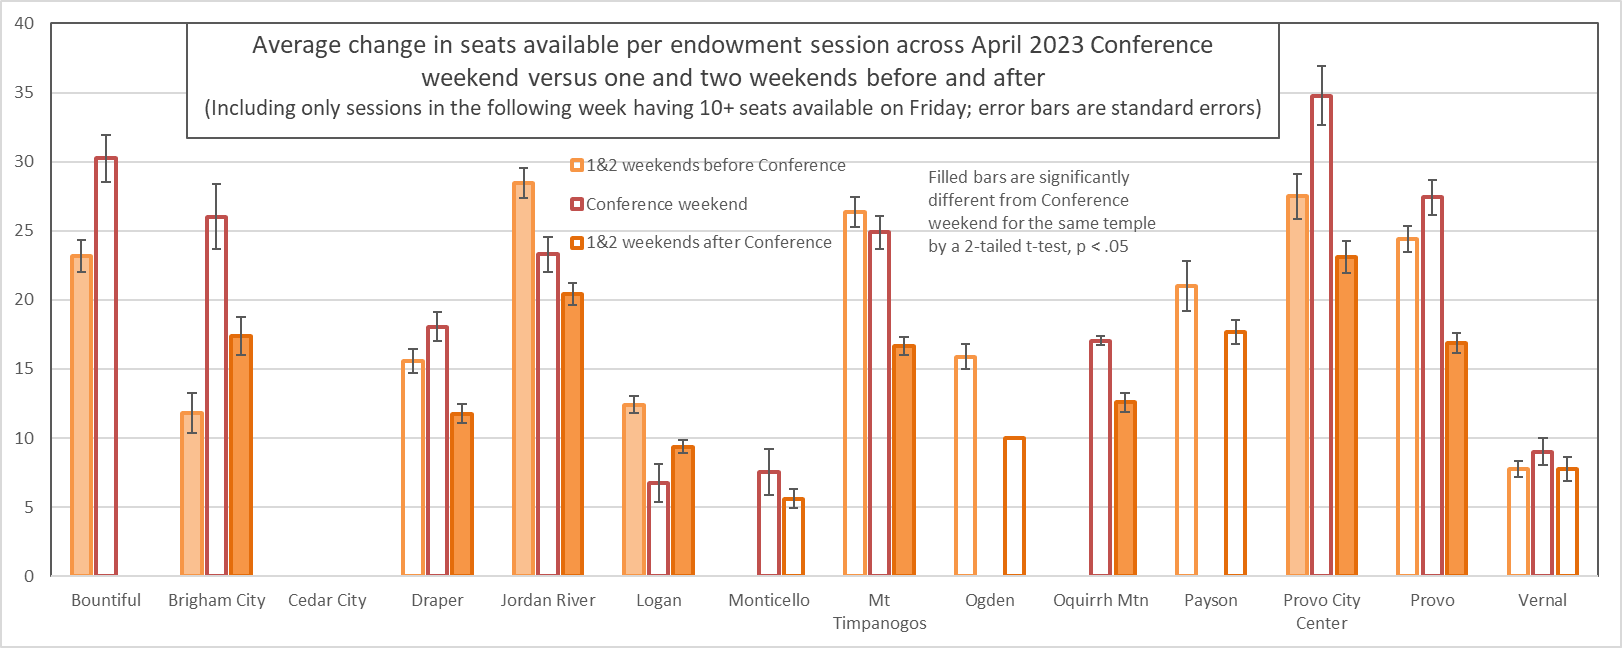
Cedar City disappears entirely. It has been taking on demand from all over southern Utah while St. George is being renovated, so it had no sessions that had ten or more seats available when I checked on Friday. Also, as you might expect, Oquirrh Mountain’s negative before-Conference bar disappears as all the sessions for that week had fewer than ten seats available when I checked on Friday. As far as statistically significant differences, Brigham City and Provo City Center now have them for both before-Conference and after-Conference weekends compared to Conference weekend, and Jordan River’s stair-step decline pattern is now statistically significant in both of its steps.
Overall, it looks like the support for my hypothesis that people would make more temple appointments during Conference weekend is pretty weak. In the non-Utah temples, although the pattern of Conference weekend being the highest was common, most of the differences were not statistically significant, and may just be chance. In the Utah temples, while there’s more support, there’s also the complication of demand moving from one temple to another that I don’t have a good way to adjust for. Maybe I’ll revisit this question another time with more thorough data collection.
OMG – so much effort ! thx for this informative look at the subject.
I have long felt that church with be better with more graphs.
Oquirrh Mountain is my temple, and your reasonings all seem believable enough to me. I’m not sure that I attend the temple regularly enough to have some sort of special insight to the particulars though.
One factor that I think bears considering is that the size of the temple districts and income levels of countries may have significant effects on how people plan temple trips. As a Utah guy, if I hear a conference talk about temples and decide to book an appointment, I might be able to book a session in the next week. It’s only a few minutes down the road for me, and I’m wealthy enough that I have a car and some baby sitting isn’t a major financial event. Outside of Utah, that temple is much more likely to be hours, significantly increasing the cost of going (time, money, etc.) and requiring that I plan farther out. As such, it may be that a conference talk could cause a short term spike in Mesa, South Jordan, American Fork, Provo or Draper, while causing a more diffuse spike (oxymoron?) in other locations that is both later and wider (in time).
Oh, that’s an excellent point, DaveW, that an effect might lag and be spread out across time if it’s more costly for people to get to the temple!
Raymond, thanks! I’m glad you enjoyed it!
My temple worker friend told me that every year workers were requested not to take vacations in the first few weeks of January. Like dieting, New Years resolutions for temple attendance have worn off by February, so it’s back to business as usual.
That totally makes sense, larryco_. Maybe I should look at temple activity across a new year and see how big the effect is. Thanks for the pointer!
as a regular attendee, I agree that January vs February at the temples is like January vs February at the gyms. There’s also a large fluctuating change in Utah numbers at various temples based on which local temples are closed for cleaning, I don’t know if that was a factor in your research. Thanks for your interesting queries and insights!
Thanks, acw! And yeah, I should definitely look at the beginning-of-year changes and the shifting of demand to nearby temples when one closes temporarily. I’m guessing that when Salt Lake finally re-opens, it will be interesting to see to what degree it soaks up demand from other nearby temples versus creating new demand.
Some extra messiness: In some places the time zones are a poor match with MST, like in New Zealand. In New Zealand, for example, the Sunday afternoon session (2pm MST) is Monday morning (8am NZT). General Conference is screened the weekend following live General Conference. Keen beans can watch sessions early, but I’d guess a majority just view them on the New Zealand conference weekend.