I read a mention somewhere recently of the fact that you can rate and review LDS temples on Google Maps just like you’d rate or review a restaurant or bookstore. I thought it might be interesting to take a look at this rating data, just to see what’s there. For each of the 168 temples that has been dedicated, I noted the following:
- Number of ratings of each possible number of stars (1-5) — note that all that’s shown by Google Maps is a little chart, but if you poke into the HTML, you can find the actual counts of ratings
- Top words from the reviews and how often they were used — Google Maps helpfully compiles these
- Year the temple was dedicated — from Church website
- Location of the temple, which I aggregated into the following regions: Utah, West US (excluding Utah, divided at Mississippi River), East US, Canada & Alaska, Mexico & Central America & Caribbean, South America, Europe, Africa, Asia/Pacific (including Hawaii)
I also browsed through some of the reviews, and copied snippets that I found funny or interesting. I’ll share those in an upcoming post.
Average ratings
To start, the most interesting question to me is which temple is rated highest. Unfortunately, although I can give you an answer, there’s just hardly any variability to speak of. On the 5-star scale, temples’ ratings range from Tokyo Japan at the low end with 4.48 up to Detroit Michigan at the high end with 4.97. Really, across temples, it’s just a bunch of ratings of five stars, with only the occasional four or lower. And in retrospect, this probably isn’t all that surprising, as it’s overwhelmingly going to be Mormons rating the temples, and they’re overwhelmingly going to give five stars. There are definitely non- or ex- or anti-Mormons rating temples, and sometimes giving lower ratings to show their displeasure, but compared to ratings by Mormons who love to see the temple, they are few and far between.
So instead of looking at average rating for each temple, I went back and looked just at the percentage of ratings that were five stars. Looked at this way, the data has a little more variability. The lowest value is 75.3% for Suva Fiji, and the highest is 98.2% for Palmyra New York. It doesn’t look like there are any real differences by dedication year, but there might be by region. Here’s a graph. I’ve ordered the regions by highest to lowest average.
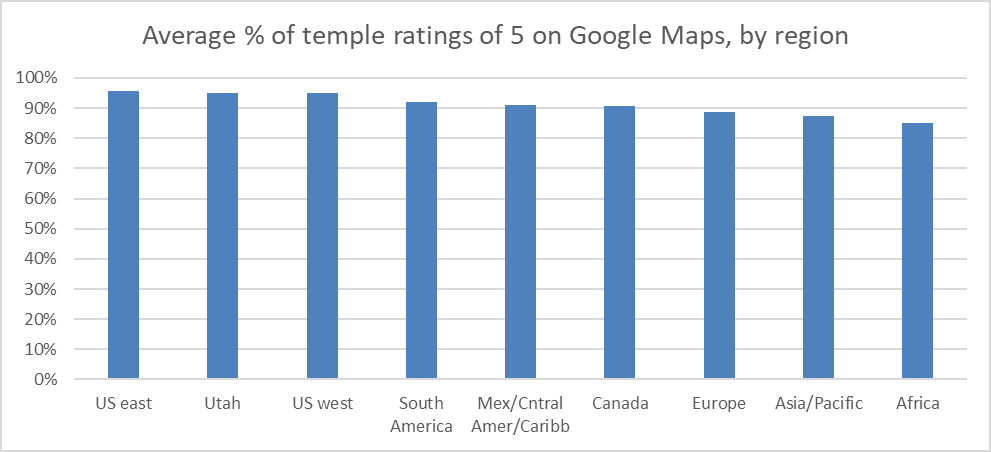
It’s interesting that the US regions have the highest averages, followed by the other Americas regions, followed by the rest of the world. I did two statistical tests (t-tests, two tailed) to compare the groups of regions, one comparing US versus other Americas and the other comparing other Americas versus the rest of the world. Both were statistically significant (p < .001). This means it’s unlikely that we would see differences this big between the groups if the underlying populations actually had the same average percentage of five-star ratings.
(There are several caveats to these test results. The most obvious one is that this is a clear data fishing exercise, where I only made up the groups after looking at the data, so the tests should be taken with a big grain of salt. Another is the question of what it even means in this situation to imagine an underlying population. The temples are what they are: there’s no sampling. They’re the entire population. So you could argue that there’s no reason to do statistical significance tests at all. I think it might make sense to imagine a population of hypothetical temples that the Church hasn’t built but could have, but I wouldn’t argue that too hard. The last caveat is that even if the differences are real, it’s not clear what they even mean. They might not say anything about temples or the Church at all, and might instead just reflect something like how positive people feel about using Google products in different regions of the world.)
One other pattern I thought might be worth looking at is the average rating by temple versus the number of ratings. This scatterplot shows the relationship.
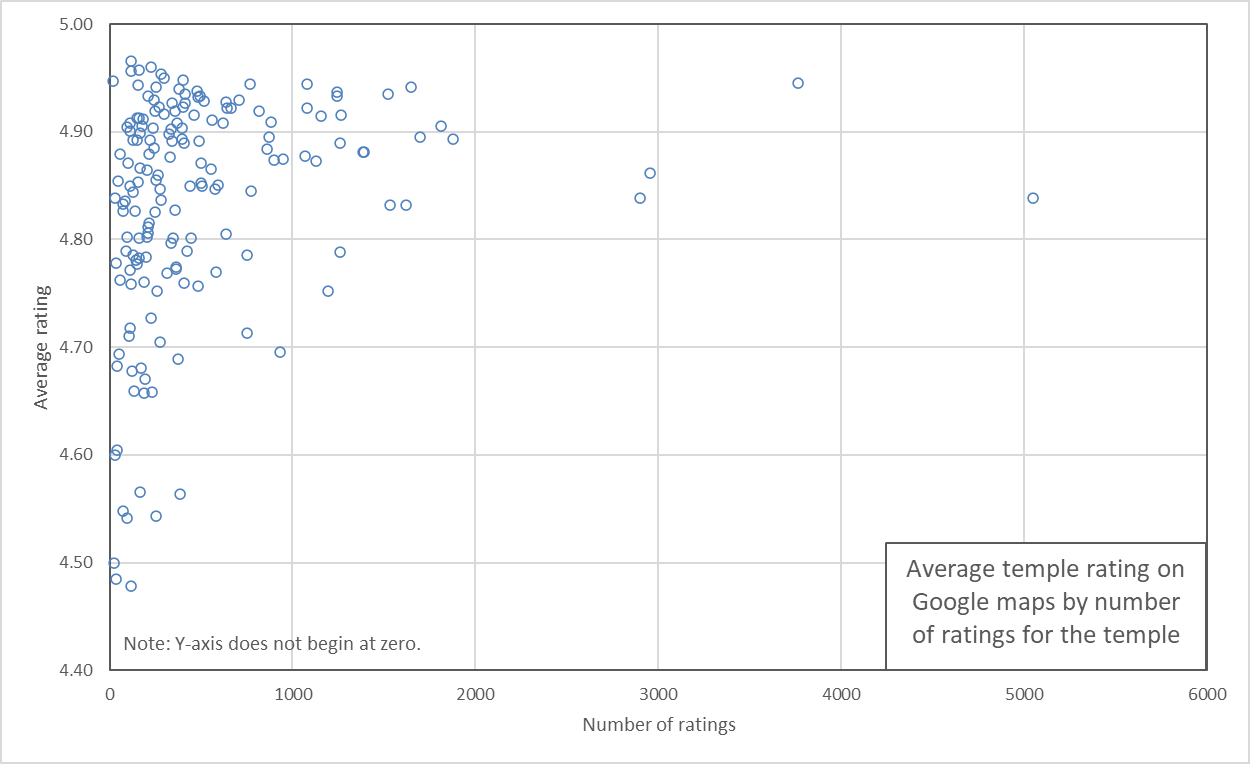
Each temple is represented by a circle. Its horizontal distance across the graph shows its total number of ratings; its vertical distance up the graph shows its average rating. For example, the Salt Lake Temple is the circle just to the right of the 5000 line, with an average rating of 4.84. Note that because there are no average ratings below 4.48, I cut off the bottom of the graph below an average rating of 4.40 so it’s easier to see the data.
It looks like temples that have fewer ratings have more spread in their average ratings, and temples that have more ratings have less spread. This would be expected if we think of each temple’s set of ratings as a sample from a big population of temple ratings that’s pretty much homogeneous, regardless of the temple. This population has a whole bunch of five-star ratings, a few four-star ratings, and fewer three-, two-, and one-star ratings. The smaller samples are more spread out because that’s just the nature of sample size: the bigger a sample you take (the more ratings), the closer you get to the population average. The pattern would probably be clearer if the average rating were a little lower, and then the small samples (temples with low numbers of ratings) would be spread out both above and below the population average. But because the average of 4.83 is so close to the top rating, there’s not much space for the ratings to spread out above it.
Number of ratings
As you can see in the scatterplot above, there’s quite a bit of variability in the number of ratings different temples get, from Salt Lake at over 5000 down to a few temples that have fewer than 100. This next graph shows the number of ratings for each temple by region.
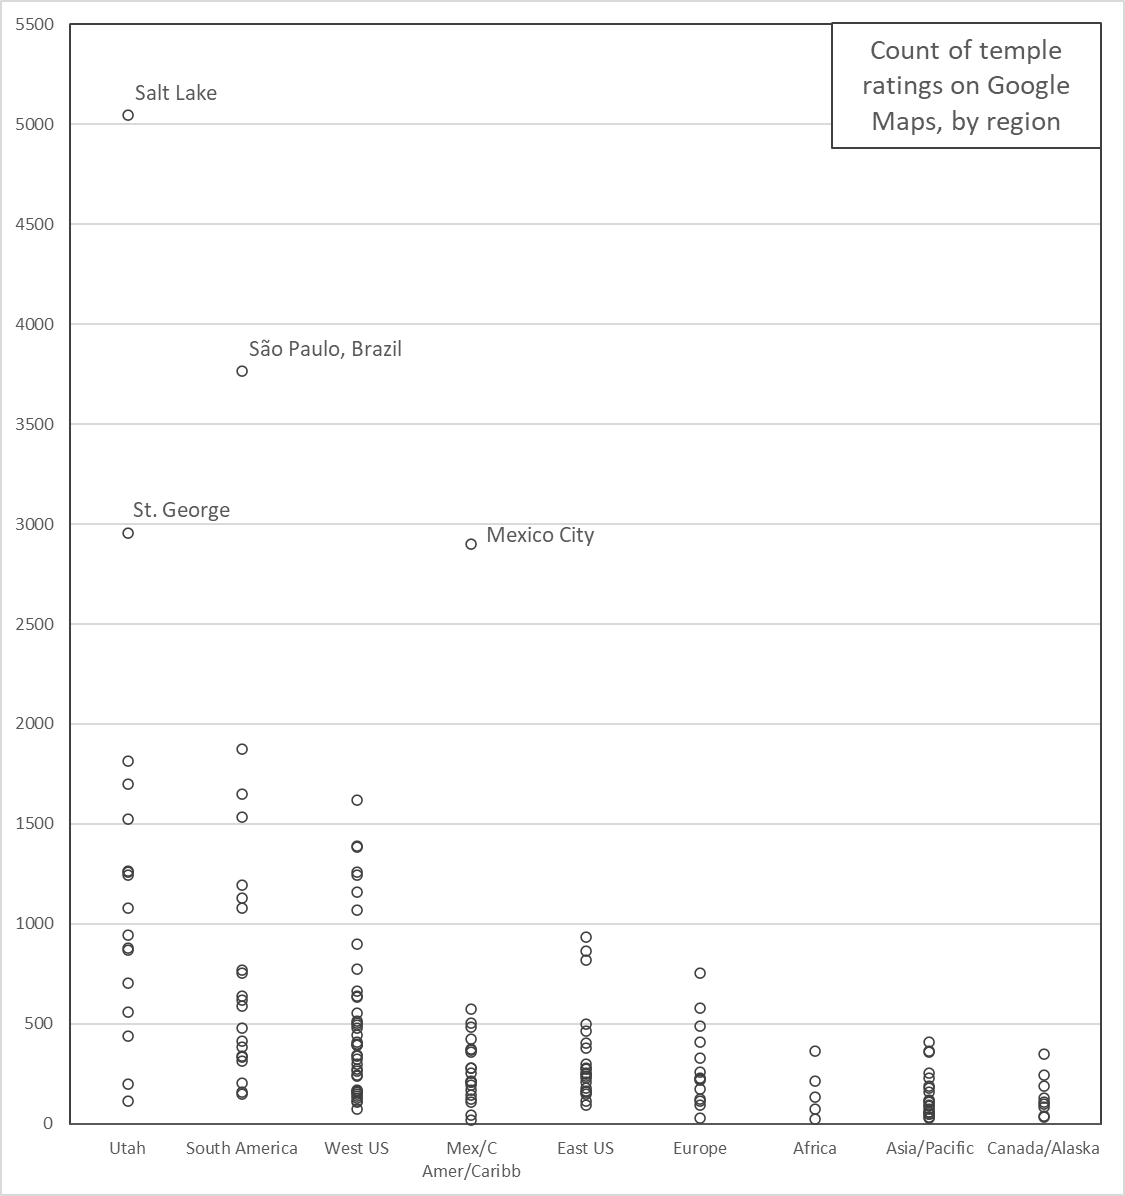
The regions are ordered by largest to smallest median number of ratings. You can see where there are lots of temples (e.g., West US) and where there aren’t many (e.g., Africa). There are a few very high outliers that I’ve labeled. Even if those are set aside, there’s a clear pattern of temples in some regions drawing more ratings than those in others.
It looks like some of the differences in number of ratings might be attributable to age of the temple, as the high outliers are all at least several decades old. Mexico City is the most recently dedicated, in 1983. This next graph shows number of ratings by dedication year.
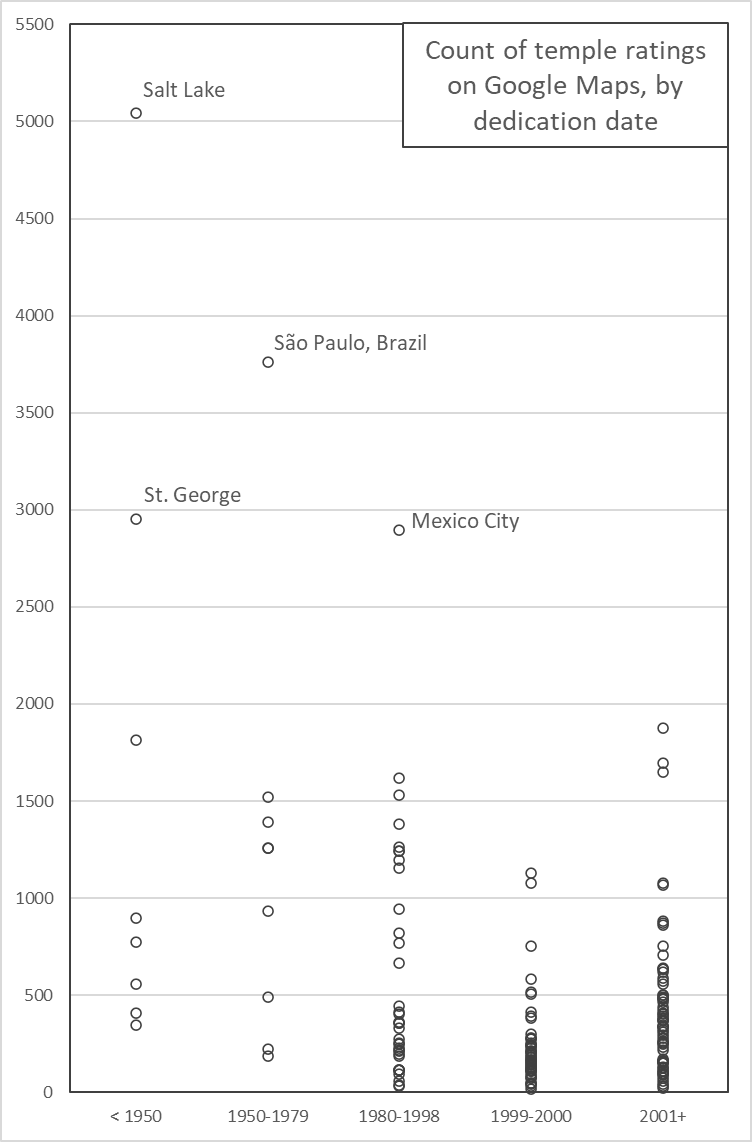
When I first did this analysis, I had the 1980-1998 and 2001+ groups each broken in two subgroups, but in both cases, there was virtually no difference between the subgroups, so I collapsed them together for simplicity. In any case, other than the pattern of older temples drawing more ratings that I already mentioned, the clearest pattern here is that the Hinckley-era mini temples of 1999-2000, which I made their own group because there were so many of them, draw the fewest reviews.
But of course age and region are correlated, as the oldest temples are most likely to be in places like Utah. In this next graph, I’m showing number of reviews by both region and age. I didn’t just jump to this graph right away because I know it’s a little busy. Note that I’ve added a little random horizontal shift to the data points to make them easier to see where a lot are clustered together.
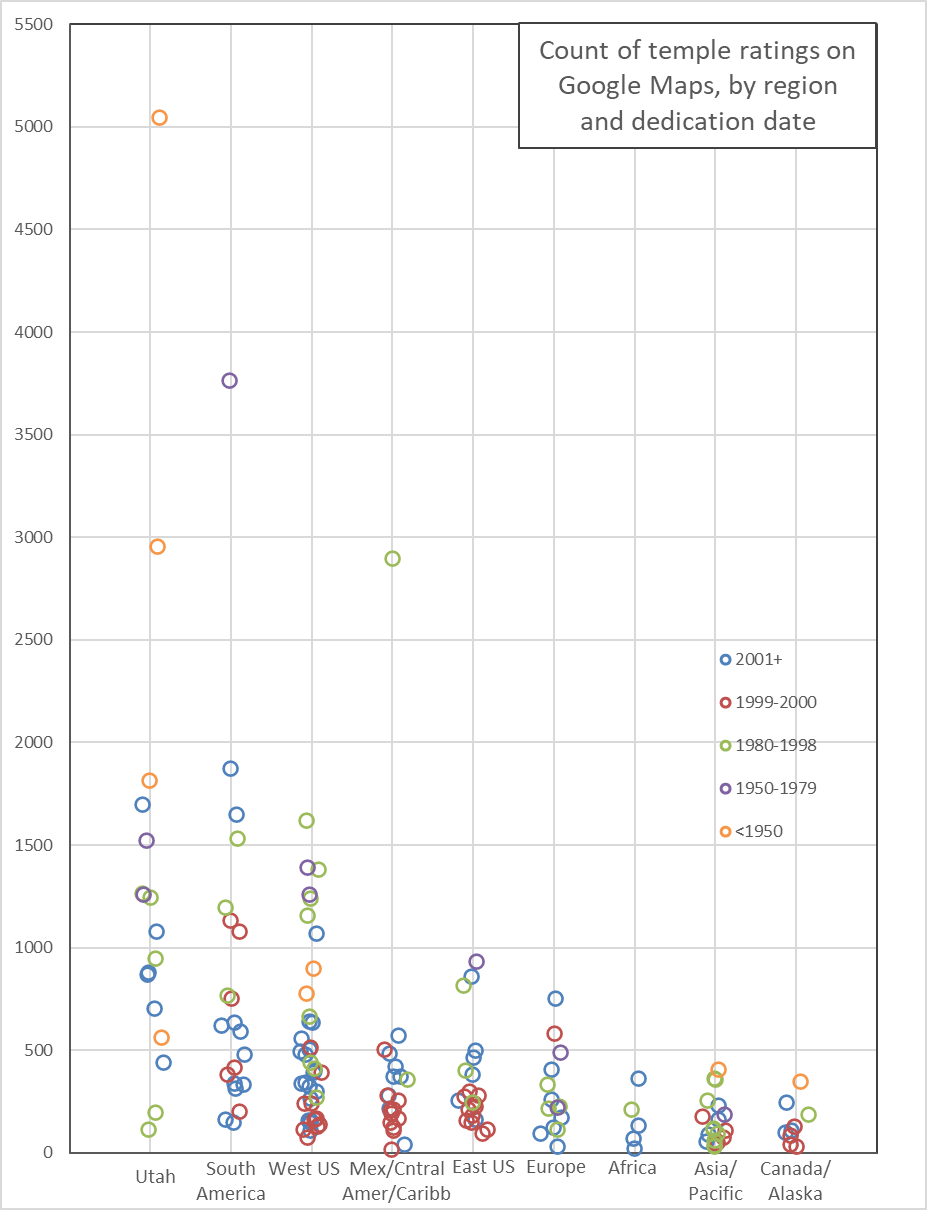
So Utah temples don’t just get large numbers of ratings because they’re old (the top three are Salt Lake, St. George, and Logan), but actually even in some of the newer ones. The top blue circle in the Utah column is Provo City Center, with nearly 1700 reviews even though it was only dedicated in 2016. In the other columns, you can see the age effect, with the orange and purple circles often toward the high end, and the reds (1999-2000) toward the bottom. Also, even aside from looking at the rating counts, it’s interesting to see things like that the 1999-2000 crash build put zero new temples in Utah, and only one in Europe, but a bunch in the rest of the US, Mexico, Central America, and the Caribbean, and Canada. Since the turn of the millennium, more have been built in Utah and Europe, and in Africa, which was also locked out of the 1999-2000 rush.
Review words
For each temple (other than a couple that have a very small number of reviews), Google gives the most commonly used words in the reviews along with a count of how often they were used. I noted these words for each temple, and put them into 28 categories. For example, I lumped “peace,” “peaceful,” “inner peace,” and “tranquility” together into a category I called “peace/tranquility.”
For the 168 temples, there were a total of 22,518 top word mentions. There are two important things to note about this number. First, Google of course doesn’t show every review word; it only shows the most common. For most temples, the minimum number of times a word had to be used to appear on the list was three to five. Second, many people give star ratings to temples without writing a review. I didn’t count the number of actual reviews, only the number of ratings. So if it looks like even the most commonly-used words aren’t used that much, remember that by counting ratings, I’m including a bunch of blank reviews in the total count.
Here are the top ten word categories across all reviews. In addition to the total count of the number of times a word in each category was mentioned, I also calculate the average percentage of ratings for each temple that use a word in the category.
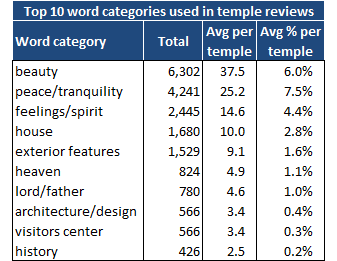
Note that “beauty” scores as number one for total mentions, but for average percent, “peace/tranquility” wins out. This just means “beauty” is mentioned relatively more for temples with larger total numbers of ratings, where each mention counts for a smaller percentage, while “peace/tranquility” is mentioned relatively more for temples with smaller total number of ratings, where each mention counts for a larger percentage.
(Here’s a simplified example to clarify what’s going on. Temple A has 1000 total ratings, with 100 mentions of “beauty” and 80 mentions of “peace.” Temple B has 100 total ratings, with 4 mentions of “beauty” and 8 mentions of “peace.” For the total mentions, “beauty” has 100 + 4 = 104 and “peace” has 80 + 8 = 88, so “beauty” is higher. For the average percent, though, “beauty” has 10% [100/1000] and 4% [4/100], for an average of 7%, and “peace” has 8% [80/1000] and 8% [8/100], for an average of 8%, so “peace” is higher.)
Since “beauty” and “peace/tranquility” are the top two by a pretty large margin, I thought it might be interesting to look at which temples have these words mentioned most often in their reviews. Here’s the list for “beauty.”
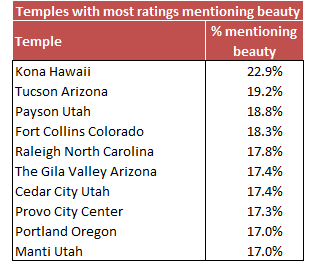
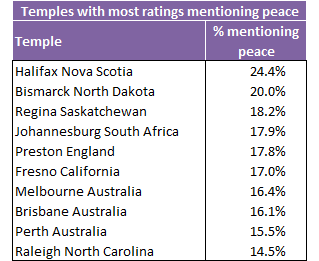
I’ve only seen a few from the “beauty” list in person, and one (Provo City Center) only before it was converted from a tabernacle into a temple. I’d love to hear what anyone who’s seen more temples than I have on which you think are the most beautiful. I haven’t seen any of the “peace” ones. “Peace” is mentioned for so many of the temples (133 of 168) that it almost seems like just a generic thing people say about temples. “It was peaceful.”
Finally, here’s a list of some words that appear in reviews for only one temple (or at least, appear in reviews enough to make the top words list only once).
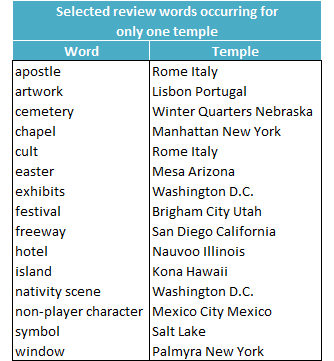
The Winter Quarters Temple is next to a pioneer cemetery, so that makes sense, and the Mesa Arizona Temple hosts (hosted?) an annual Easter pageant. The Palmyra New York Temple has a window that looks toward the Sacred Grove, and several reviewers mentioned that.
Of course the one that really requires some explanation is “non-player character” for the Mexico City Mexico Temple. I looked at the individual reviews, and it looks like what reviewers mentioned was actually “NPC,” which Google then helpfully guessed meant “non-player character.” With my (very) limited Spanish, though, I guessed that reviewers were actually referring to “Nuestro Padre Celestial” (“Our Heavenly Father”). When I googled this phrase, sure enough, the top few hits were from the Church website, so I strongly suspect that I’m right.
In another post in a few days, I’ll talk a little more about what people actually say in their reviews, and quote a few that were funny or otherwise interesting.
I love this so much! Another great post giving me stats of Mormon things I didn’t know that I wanted to know.
Thanks, that’s intriguing! Don’t think I’ve ever gone in to review a temple on Google. I’ve been to several on the “beauty” list but don’t know that they’re more beautiful than other temples, I think that’s personal preference. Payson and PCC do stand out in Utah as newer and more unusual, perhaps. I personally think the stained glass in Winter Quarters is stunning–is stained glass a frequently mentioned term too? Do you worry that by raising this awareness, there will be a flood of negative reviews come in?
These ratings tell you almost nothing about the temples, but might say something interesting about the raters. In that case, you could view the raters as a (nonrandom) sample being drawn from an underlying population. (And what is that underlying population? Probably the number of members in the temple district or, perhaps, the number of stakes * 2,000.) Try rerunning your T-tests with that in mind to see if the regional differences are still statistically significant. I’m guessing that they will not be, which implies that the regional differences would disappear as the sample size increases.
That’s so interesting! I would’ve guessed much lower reviews! Even active church members who regularly attend the temple don’t always love it (I was in that boat for years). Everyone I talk to individually about the temple finds it confusing and weird. Though I don’t know why I assumed people would be more honest on Google reviews than they are in relief society.
I wonder if people who find the temple experience uncomfortable still give their temple a 5-star review and call it missionary work or if they don’t review at all. Probably the latter.
Those graphs were so interesting! I probably learned a little bit about statistics reading this article!!
Thanks, Geoff and acw! I’m glad you enjoyed the post. acw, yes, stained glass does show up 47 times for five different temples: Cedar City Utah, Mount Timpanogos Utah, Payson Utah, Rome Italy, and San Antonio Texas. It was probably mentioned for other temples too, but fell below the minimum word count threshold for Google Maps to report it. Sorry–I’m realizing that I probably didn’t make explicit this point about the very last table in the post: it comes from actual words people wrote in their reviews before I lumped them together into my categories. So in my categories, both stained glass and window mentions I counted as “interior features.”
Last Lemming, that’s a really interesting reframing of it. It totally makes sense to think of reviewers as a pretty homogeneous populations across temples. So when I went back to do as you suggested, I realized that because I’ve dichotomized ratings into just <5 and =5, then when I use the individual raters' data, each test is just a little 2×2 table that I can test with a 1 df chi square. There are over 86,000 total ratings of temples, though, so these tests have a ton of power. Both return a p-value of essentially zero. (The critical value for a 1 df chi square at alpha = .05 is 3.84. Both test statistics are greater than 100.) Ultimately, I think you’re right that the rating population probably isn’t very different, but they’re probably not exactly the same, and these tests are really overpowered.
Emily, thanks! I’m glad you enjoyed it. I agree with you that I think certainly lots of people don’t always have the best experiences in the temple. I wonder, though, if because the ratings are public, like you said, people feel the need to be good missionaries and paint the Church in as positive a light as possible. I wonder if it isn’t kind of a similar impulse to when a surprising number of people rate any Church-related movie with the highest possible rating, also, I suspect, with missionary work in mind. (If you’re interested, I wrote a post last year where I looked at rating patterns of Mormon-related movies: https://zelophehadsdaughters.com/2020/09/10/ratings-of-mormon-movies-on-imdb/).
And if you learned a little bit of stats from reading this post, that’s wonderful to hear! I used to be a stats teacher, so spreading the good word of how much fun they can be is always near and dear to my heart!
Ziff, you’re the best!
Also, I am reminded of the apocryphal story of a gentleman who ordered his lunch in a temple cafeteria, and shocked the food worker when he asked for a coffee. After some questioning, the gentleman said “Oh I’m not a member and I’m not trying to sneak into the sacred parts of the temple. My good Mormon friend has been talking for ages about how great the cafeteria food is here. Finally I asked him to prove it, so he lent me his recommend and made me promise only to visit the cafeteria. Here I am!” Perhaps he might have left a 5-star rating for the food.
Great article! The references to ‘non-player characters’ in Mexico City caught my eye. Couldn’t quite understnd the link between video games and the temple. Upon further analysis, it looks like Google took the Spanish acronym NPC (Nuestro Padre Celestial, or Our Heavenly Father) and incorrectly applied the English acronym for Non Player Character instead.
Thanks, Bro. Jones! And that’s a great story!
Thanks, Dan. And right, I reached exactly the same conclusion if you look back at the next-to-last paragraph of the post (I realize it’s a bit of a slog).
I guess I don’t have the requisite interests to be familiar with the term “non-player character.” When I saw the expression listed in the table, my first inclination was to try to parse it as making some reference about whether the temple has live actors as in Salt Lake and Manti, or characters on film as everywhere else.