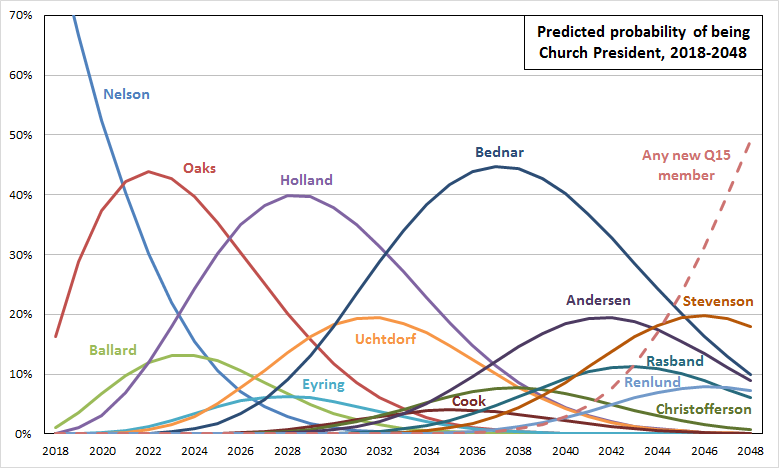
As a supplement to yesterday’s post, I’ve made the graph below that shows the year-to-year probabilities of each Q15 member being President.
The values come from the same mortality table that I used to run the simulation to find the likelihood of each Q15 member ever becoming Church President. This graph doesn’t require any simulation, though. For each Q15 member, I just used his yearly probabilities of survival to come up with yearly cumulative probabilities of survival (i.e., how likely is he to live through this age). Then for each Q15 member, his yearly probability of becoming President is the probability that he survives the year and that all the members senior to him do not. This is found by multiplying probabilities, so for example for Elder Ballard, who is junior only to President Nelson and Elder Oaks, his probability of being President in a particular year is this:
(Ballard cumulative probability of living)*(1 – Nelson probability of living)*(1 – Oaks probability of living)
The results look similar to what we’ve seen in the past with graphs like this, in that there are big probabilities across periods of years for Elders Oaks, Holland, and Bednar. The one big difference is that, as el oso noted yesterday, President Nelson jumped from a pretty low probability for most of his time in the quorum to 100% when President Monson died. I guess this just illustrates that applying a mortality table that gives general trends to a small group of people as I have here is bound to be wrong in big ways at times.

Thanks, Ziff. Obviously, Pres. Nelson is an anomaly. He’s unusually vigorous for a 93-year-old. Just to put this in perspective, he and Pres. Packer were only one day apart in chronological age. But from appearances, there could have been 20 years between them.
Great point, Wally. That’s kind of amazing!
Ziff, have you run a correlation graph between predicted past outcomes and actual outcomes?
Good question, Steve. I have, but it was back in 2015. Here’s the post.
https://zelophehadsdaughters.com/2015/05/11/predicting-who-will-be-church-president-fit-of-actuarial-mortality-table-to-historical-data/
What is the assumed starting age of “any new Q15 member”?
Good question, but it actually doesn’t matter what the new members’ starting age is for purposes of this graph. Another way of thinking of that pink dashed line is just the probability that all current members of the Q15 will have died by that point in time, meaning that necessarily someone not yet called will be Church President.
So what I see is we are not likely to have a leader younger than 87 unless there is a change. Looks to me like the church is damned by tradition, unless th e e is a change.
Its all very well claiming we have a Prophet. The inference being someone who recieves revelation, not holds the title.
On Sunday we studied Moses 1, where he describes meeting face to face with the Lord. He also describes falling to the earth and not recovering for many hours. This was before the exodus, when presumably, he was in his prime. If it does that to a man in his prime, does a 90 year old survive the experience?
Perhaps we redefine revelation as Nelson did, when talking about the POX. But that is filtered through ones prejudices. You need the Moses type revelation to get Gods will to overrule the Prophets will.
Not a lot of hope for the church without real revelation.
There are literally dozens of SOA mortality tables – which one did you select and why?
Mark Shaw, Fellow of the Society of Actuaries
I linked it in the post. Here you go:
https://www.soa.org/experience-studies/2014/research-2014-mort-tables/
I used it because my actuary friend recommended it.
Ziff Zelophehad, Friend of a Fellow of the Society of Actuaries
Hey Ziff, fantastic data you put together here, thank you for posting it. Do you mind if I cite and link the information on an upcoming podcast episode?
Thanks, Bryce! You’re welcome to refer to this stuff on your podcast. Thanks for sharing it!
@Ziff, Are you going to update the stats now that we have two new GAs?
Yup! I’m planning on updating it soon.
Any chance of using a mortality table from DMBA? Mortality rates of active LDS are different than the rates in the standard tables.
That’s a good question, David. I doubt it would make a lot of difference, even if I had access to such a table. The issue is that as long as I’m applying the same table to all 15 members, shifting them all up or down together doesn’t have a whole lot of effect on who ends up predicted to be president.
Here’s a post I wrote once where I checked the historical fit of Q15 members’ lifespans to the SOA table I’m using. As you might guess, the Q15 members lived longer on average than the table expected. But like I said, when I put that adjustment in for all of them, the probabilities didn’t change much.
https://zelophehadsdaughters.com/2015/05/11/predicting-who-will-be-church-president-fit-of-actuarial-mortality-table-to-historical-data/