Just how big is the bloggernacle?
This question occurred to me after reading some discussion of what constitutes a “big” blog during voting for the 2006 Niblets. That discussion focused on traffic and type of content, but it inspired me to think that there’s lots of easily accessible information about size in the bloggernacle: it’s in the posts and comments. So I’ve gathered some information on posts and comments from several blogs, and I plan to use that data in a short series of posts to answer some numerical questions about the bloggernacle.
Unfortunately, as the bloggernacle is big and growing, and I have limited energy, I’ve had to limit my data gathering to 11 group blogs. These include the big three–By Common Consent, Feminist Mormon Housewives, and Times and Seasons–and eight others: Exponent II, Faith Promoting Rumor, Millennial Star, Mormon Mentality, Mormon Mommy Wars, New Cool Thang, Nine Moons, and of course Zelophehad’s Daughters. I’m sure my sample is biased by what I like to read, but given that it includes the most trafficked blogs in the bloggernacle, I think it’s probably not too unrepresentative.
So, how big is the bloggernacle sample? In 2007, the 11 blogs in my sample had a total of 3525 posts, with a total of 1,807,946 words1. Just to give you an idea of how long that is, the Book of Mormon (Project Gutenberg edition) has 293,472 words, so the total length of all the posts was over six Books of Mormon. Or, following the old convention of 250 words per manuscript page, this would make for about 7232 pages of text. The mean post length was 513 words, and the median2 was 399 words.
These posts drew a total of 126,796 comments3. The mean number of comments per post was 36; the median was 22. The total length of the comments was 12,840,199 words (over 43 Books of Mormon or 51,361 manuscript pages). The mean comment length was 101 words, and the median was 65 words.
Next question: Does the amount of activity vary by day of the week? Here are counts of posts from blogs in the sample on each day of the week:
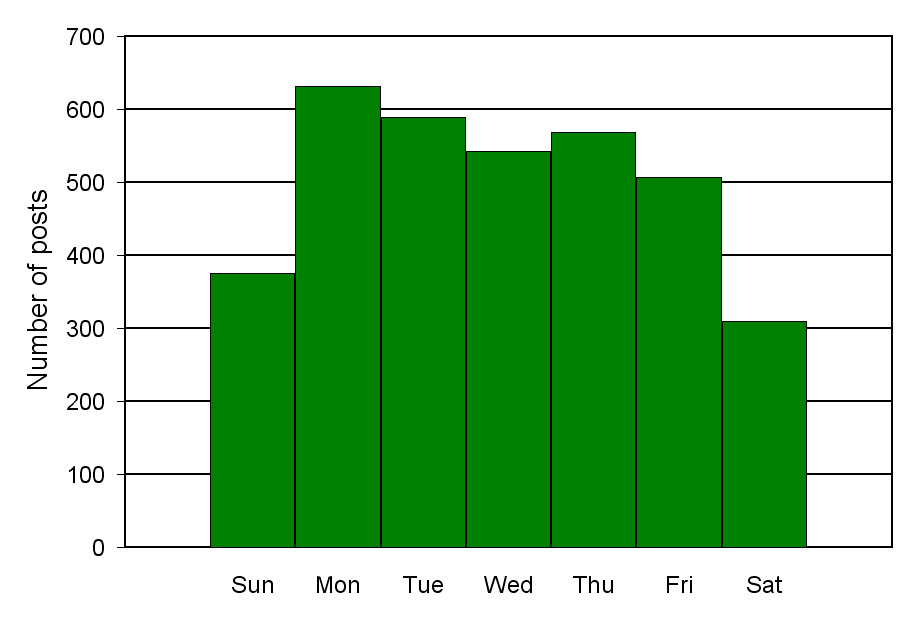
It looks like weekdays are much busier than are weekends, lending credence to Eve’s theory that blogging is a popular procrastination strategy 🙂 . The plots for comments and for total words look similar.
Okay, how about this one: Does blog activity vary by day of the year? When I plotted activity (by posts, comments, or words) by day of the year, the figure was so dominated by the within-week pattern in the plot above that it was very difficult to see any larger trend across weeks or months. To get around this, I collapsed each week to a single value, the total number of words per day in all posts and comments during that week. This plot is a little more comprehensible:
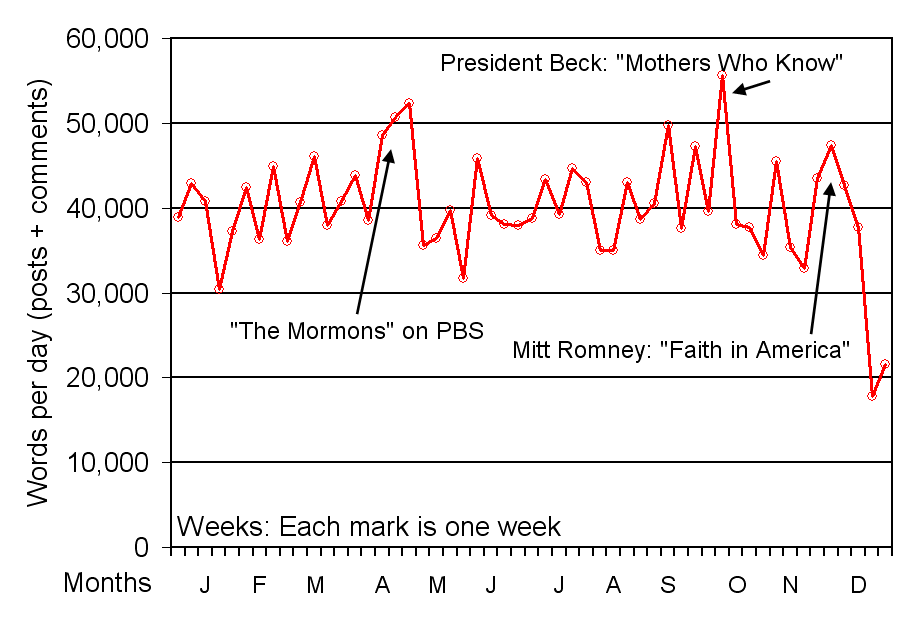
Clearly there are distinct highs and lows. I’ve labeled a few of the highest high points with the single topic that seemed to be driving most of the discussion (although my labels are based on nothing more than looking at post titles for each week). The single busiest week of the year came in the aftermath of Relief Society General President Julie Beck’s “Mothers Who Know” talk in October Conference. The quietest week, not surprisingly, was the week of Christmas.
One other question that a plot like this might be used to answer is whether the bloggernacle is growing. It seems pretty clear that it’s growing in the creation of new blogs. But what’s not clear is whether established blogs like the one in the sample are growing. From this plot, it’s difficult to see any trend across time for these blogs. Unfortunately, there could be consistent within-year trends that can’t be seen because there is only one year’s worth of data. So I think answering that question will require more data. The most we can say based on this plot is that if there is growth in established blogs, it’s probably not dramatic.
In Part 2 of ‘Nacle Numbers, I’ll be back with some more interesting questions, those that compare the blogs in the sample to one another. In the meantime, if you enjoy this type of navel-gazing and have any questions you’d like to see answered in a future post, go ahead and ask and I’ll see what I can do to answer.
______________________
1. I didn’t actually count words. I just counted characters plus spaces and divided by six, the same strategy used in Wikipedia to compare encyclopedia sizes.
2. The mean of a set of numbers is just the arithmetic average: the sum divided by the number of numbers. The median is the middle number once they’ve all been lined up in order by size. In a case like this, where there are many smaller values (short-to-medium length posts) and fewer larger values (longer posts), the median will be smaller than the mean. This happens because the median is unaffected by the sizes of the numbers away from the middle (it doesn’t care if the largest number is 5000 or 5,000,000) while the mean is affected by the values of all the numbers. The median is often a better summary of the numbers than is the mean in such circumstances.
3. This includes comments made both in 2007 and 2008, but only those made on posts written in 2007. Of course, the number of comments can always continue to increase as long as the threads remain open. My impression is that the vast majority of posts are actively commented on for no more than a week. To be safe, I didn’t gather comment data from any of the posts until they were at least a month old. In answering some questions, I’ve looked at all comments written in 2007, regardless of what year the post they’re attached to was written (although I applied the same one month criterion as before, so I actually only looked at comments written in 2007 on posts written between December 1, 2006 and December 31, 2007). This set of comments, which largely overlaps with the set of comments on posts written in 2007, includes 127,093 comments and 12,885,711 words.
Interesting, hope to get to where you total page views next.
Good stuff. I look forward to more.
I’m sorry Stephen. I don’t have any traffic data. All I’ve got is data on posts and comments–just what I could get by looking at what’s publicly accessible on the blogs.
This is really fun stuff. I am betting the first upswing(mormons on PBS) was helped by April Conference general chatter, and Becks’ Mothers who know was helped by October conference general chatter.
Fun post, Ziff! I wasn’t surprised to see that Monday was the busiest day of the week–there’s nothing like the beginning of a new week to make one want to avoid what one should be doing and blog instead. 🙂 I was interested to see that there was slightly more activity on Sundays than Saturdays, though, as I would have guessed the reverse. Sundays seem really quiet–though maybe I’ve just gotten that impression from how slow things are on Sunday mornings when lots of people (at least, ones without horrible 1-4 block times) are at church.
I’m looking forward to your next installment!
This is really cool and very informative. Thanks.
By the way, with the Beck talk and the other events that created the peaks at the blogs that formed your sample, blogs all across the bloggernacle, from solo blogs to small group blogs, also put up posts on those topics, so it would be interesting to use, e.g., the MA (i.e. all the blogs that the MA aggregates) as your sample set.
Matt, I’m sure you’re right about the Conference trends. There are probably spikes in discussion every year as everyone predicts what’s going to happen at Conference, especially when a new member of the Twelve will be called, and then talks about what was said.
John F., I completely agree that a larger sample would be better. Unfortunately, I’m not smart enough to figure out how to use a crawler program to gather data for me; I’m limited to copying and pasting text from blogs as I read, and then feeding them into my analysis program. That’s why I had to limit the sample size.
The 1 to 4 block time is horrible? I beg to differ.
And, nifty work here, Ziff. I’m interested in the valleys as much as the peaks – looks like the holidays really do screw things up blogwise.
Great graphs and interpretations, Ziff. I am impressed with your work here–it’s the kind of information that I am interested in reading but that I would never, ever compile myself. Thanks.
Ditto Idahospud.
Ziff, my only question is what kind of household chores are you neglecting while compiling this massive data?
This is really cool, though. You’ll have to explain all of your findings to a 5th grade level though, b/c I somehow missed taking statistics in college.
Oh, I do have a question, but I don’t know if you can compile this data.
Can you track how many comments (what percentage maybe) are made by ‘regulars’ and how many are made by those who are less frequent to the bloggernacle, or to a specific blog? I’m just curious, but I assume that there are a larger variety of commenters at fMh than at T&S or BCC. Also, you’ve got a pretty good core of die-hards here that comment regularly. That’s all.
So, carry on in this great work, but just make sure you’ve taken the garbage out! 🙂
Very cool. I love stats. I’d probably hate taking a stats course.
Too bad you left out the oldest group blog though. 🙂
Kim, I’m sure you’d love taking one of my stats courses. We have giant beach ball globes, roulette wheels, and Coke vs. Coke Zero randomized taste test experiments.
Wow, a lot of work went into that. Very interesting numbers. Thank you.
Incredibly fun. Thanks for putting this together.
If it’s any help, I can say that the stats at the big blogs are still fairly dynamic.
Can you track how many comments (what percentage maybe) are made by ‘regulars’ and how many are made by those who are less frequent to the bloggernacle, or to a specific blog?
Good question, Jessawhy. I will give it a shot a couple of posts hence when I look at comments and commenters.
Also, you’ll be happy to know that my wife has let me know that blogging should be my top priority, and that I shouldn’t let my neglect of household chores or children or her or my schoolwork deter me in my quest to become the very best blogger that I can. 🙂
Too bad you left out the oldest group blog though.
Sorry to leave you all out, Kim. I wish I could have collected a larger sample but I just didn’t have time. You can certainly make good arguments, though, about which blogs I should have included or not in my limited time.
Good point, Matt B, about the holidays really slowing down blogging. As I’m sure you’ve seen if you read ZD consistently, we have little to say between about December 1st and Martin Luther King Day. 🙂 I’m impressed that more dedicated bloggers are willing to keep on writing during the holidays.
I’m wondering how you know that you picked up the most trafficked blogs in the bloggernacle.
I guess I figured that BCC, T&S, and FMH are the most trafficked, but I don’t have any data to back that up.
Perhaps I was unclear in the original. I didn’t mean to say that my sample includes only the most trafficked blogs. That is, I wasn’t claiming that these 11 blogs are the most visited. I was just saying that the 11 include the (three) most trafficked. Does that make more sense?
I could go for beach balls. even roulette wheels. I draw the line at drinking anything that has the name Coke in it.
I am now having to forcefully control my reflex action. Thanks, RT.
Ziff, that makes sense, and it is unlikely that any blogs get more traffic than those big three. I actually like the fact that your data set includes some well-known albeit less-trafficked blogs because it gives a nice range. (What I mean by “less-trafficked” is that there are group blogs that get more traffic than some on your list.)