Russell M. Nelson turned 100 this week, so it seems like a good time to look at probabilities of who among the Q15 is likely to become Church president in the future. If you’ve read ZD for any length of time, you’ve probably seen me do this before. Here’s my most recent post (and here’s a follow-up post). I’m following the same method I’ve used in the past. Using this handy mortality table produced by the Society of Actuaries, I estimate the probability of each Q15 member having died for a number of times in the future. Then, using the logic of seniority and succession, I can calculate the probability of each member becoming president from the probabilities of (1) all members senior to him dying, while (2) he survives. One small change I made this time versus previous times is that I looked at monthly points in the future rather than yearly points. It’s nice to make more fine-grained graphs, but it doesn’t change the results materially. For more on the method, see the “Method” section in my 2023 post.
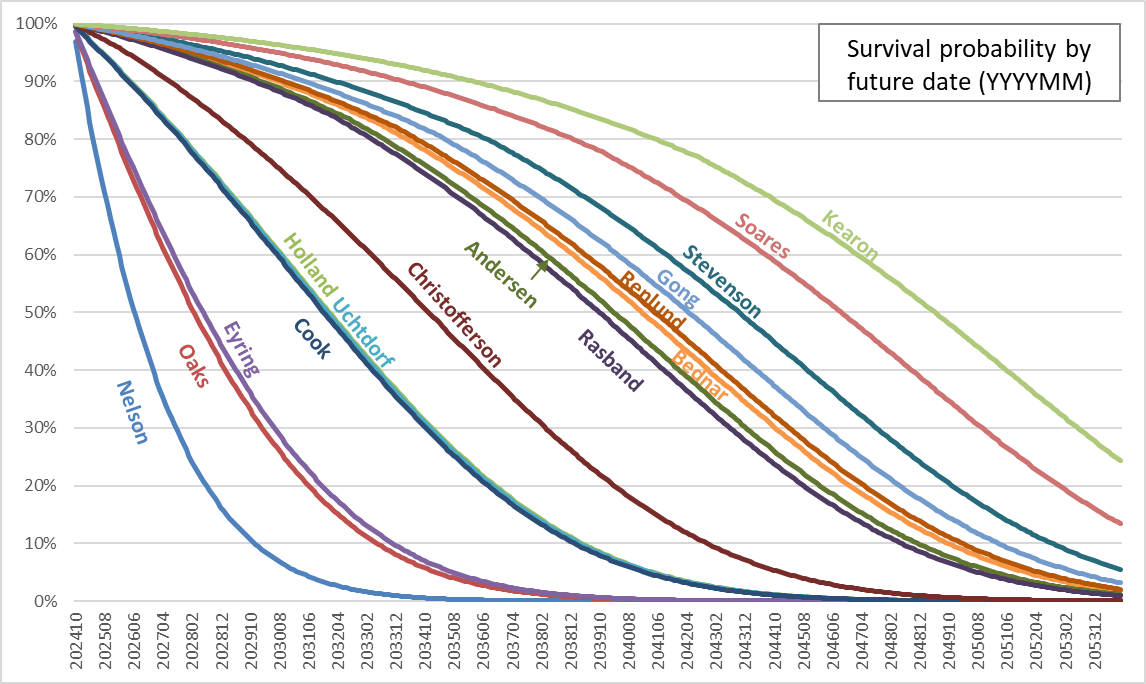
This first graph shows each Q15 member’s estimated survival probability out to 30 years (360 months) in the future. Calculating this has always been a step in the process, but I had never graphed it before and I thought it might be interesting to look at. What’s striking, I think, is where a man falls out of line with those near him in succession order. For example, Elder Bednar is between Elders Andersen and Renlund, but of course in seniority, he’s ahead of them, as well as Elders Rasband, Christofferson, and Cook, even though he is younger than they are.
This next graph shows probabilities of becoming Church president by year.
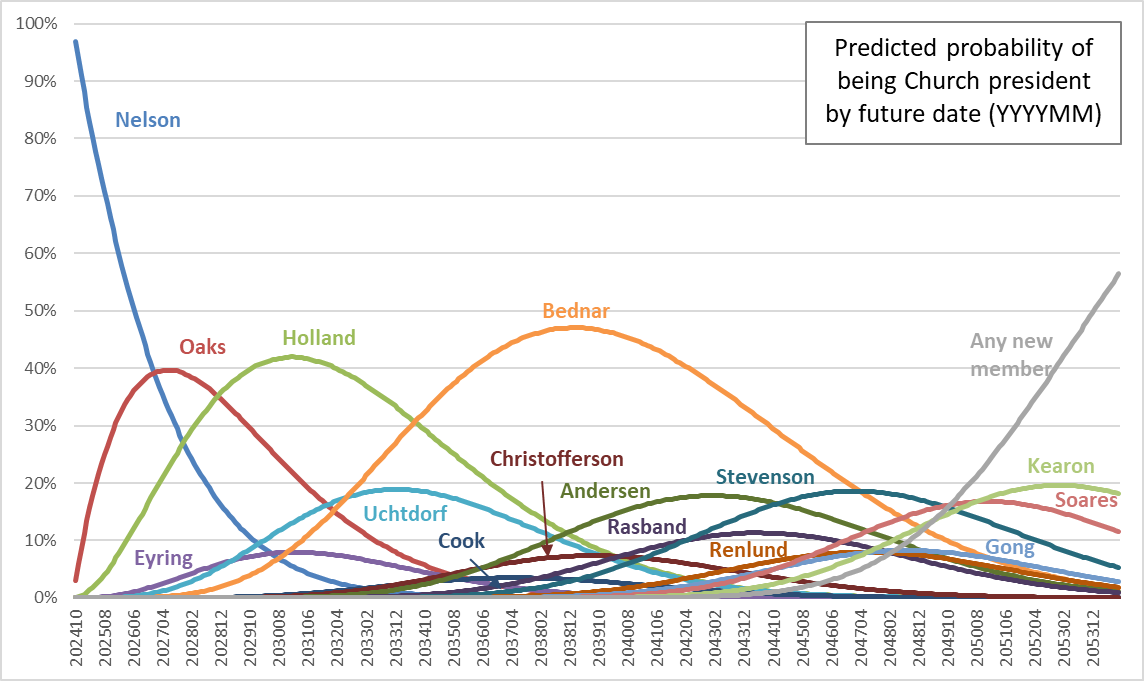
The story has been the same the past few times I’ve done this exercise. Presidents Oaks and Holland, and Elder Bednar have looked like the best bets to become Church president. What’s interesting here is that President Nelson has lived so long that President Oaks might never get the chance to become President Oaks. In the graph above, President Nelson’s blue line is crowding in on President Oaks’s red one.
Also, as always, Elders Christofferson, Renlund, and (especially) Cook look like long shots. At the very junior end, I’m happy to see Elder Kearon has a fairly good chance.
As in my previous posts, I also did a little Monte Carlo study where I picked 10,000 sets of random numbers for each Q15 member. I used the random numbers to pick 10,000 sets of number of future months lived for each of them, and again turned to the logic of seniority and succession to check in each of the 10,000 sets, whether each member would become Church president, and if so, for how long. This table shows the results.
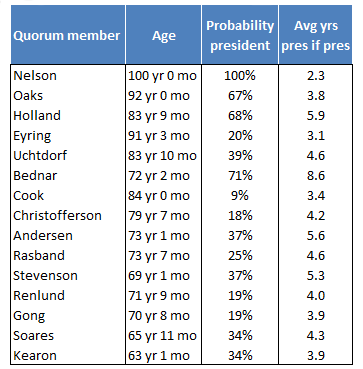
Elder Bednar could run the Church for close to a decade, although he’s only estimated to have a 71% chance of even making the top spot. This seems low to me, but I guess he is in his seventies, and even being so much younger than the men senior to him, he does have to outlive five men. And President Nelson still has 2.3 years in him possibly. (I didn’t make any adjustments for health like I attempted in my last post.)
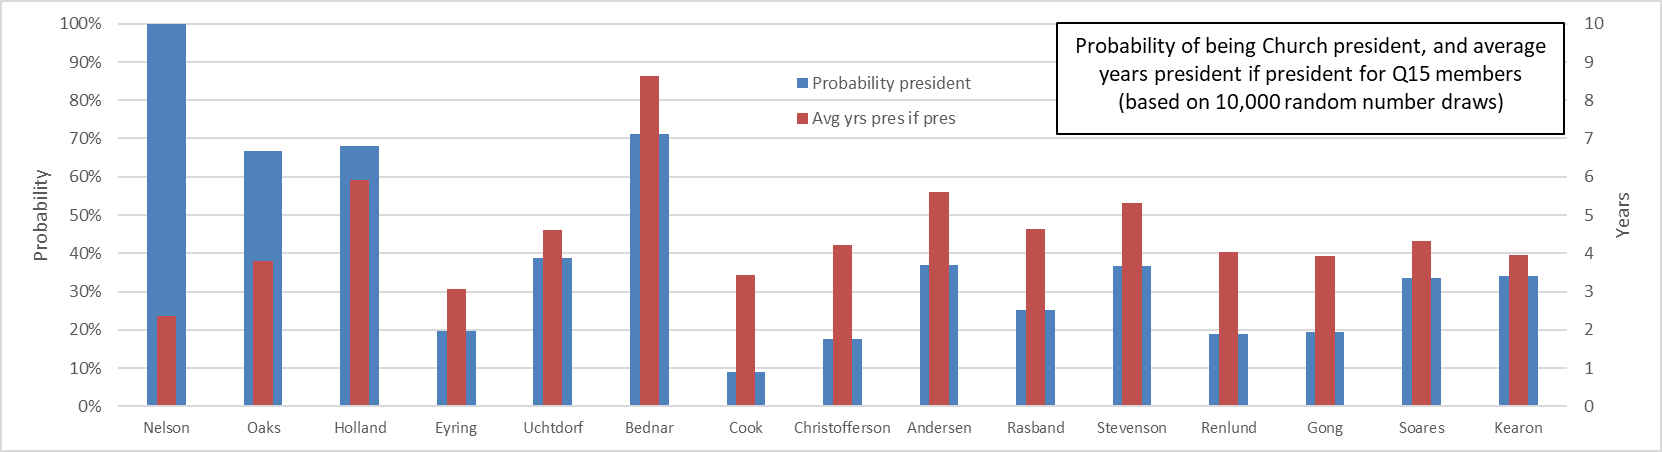
This last graph shows the same results as the table, but just in another form to make them maybe easier to look at.
I always love seeing these updated. I think the health-corrected versions you did last time convey something closer to my own sense of the probabilities. I believe you discounted the survival probabilities of Nelson and Holland. I think I might add Eyring to the mix, as he seems in more frail health lately as well, which I think would have the effect of boosting Uchtdorf’s chances above Holland’s a bit. That’s my current guess at where things stand, but it’s probably wishful thinking, making a model to fit my desired conclusion.
Someone make sure that Uchtdorf keeps exercising and is taking his vitamins.
Earlier this year, I had a very vivid dream that Uchtdorf became the president of the church and called my wife as one of a new set of apostles after releasing all the other apostles and first presidency members from the quorum of the twelve. It seems that you are saying the probability of that happening is less than 40%.
Thanks for calculating!
I’m sad to hear that Elder Holland is on dialysis. He’s also recently said that one of his comforts in grieving his wife’s passing is knowing that he won’t be long in joining her. He has also said that he feels compelled to continue his mission here.
I think it’s interesting to think that in 25 years we could have our first non-US born, racial minority, or non-native English speaker. Cheering for the next new member to bring diversity to the equation.
I’m no actuary, so it’s baffling to me that Nelson has a 40% chance of living 25-ish more months when he is already 100. Maybe he will outlive Oaks and Oaks will never formally become the president? Obviously the talks and actions of the past six months (doubling down on garments, obedience, that awful talk about an oil industry lobbyist’s definition of integrity, latest trans-hating policies, and the training on having more membership councils that Radio Free Mormon just did a show on) show that Oaks is effectively running things, but it’s all still as a #2. In some ways it would be amusing for Oaks to never get the top spot and Nelson get all of the credit/blame for stuff Oaks did while Nelson was still alive. Since we know that Nelson is all about his legacy it would be nice for his #2 to eternally tarnish said legacy.
I’m no actuary, but it’s no surprise to me. When you’re at that advanced age, you could go at any time but lacking any particular change in your status there’s no reason why you should. My grandpa made it to 102 and it was skin cancer that finally did him in, not further decline in his physical condition apart from that. (Of course, at 102 the body is too weak to withstand much anti-cancer treatment.)
I’ve always enjoyed this analysis. I’ve been comparing it to the graph from 2018, and it is remarkably similar, just pushed out in time. Back in 2018, the most likely outcomes for 2024 were Oaks(40%), Holland(23%), Nelson(17%) and Ballard(14%). Looking out 6 years this time the odds are Holland, Oaks, Uchtdorf, Eyring, Bednar.
(That chart would be much better with years on the x-axis, rather than “months from now”.)
Comparing back to your post from 2015, Packer(37%), Perry(20%), Ballard(18%), Scott(15%) and Hales(23%) never became president of the church. Nelson (23%) did, and has exceeded his 4.2 years expected. Obviously everyone who is still alive has only increased their odds; no one can pass them in seniority, so there can only be fewer people to need to outlive to reach the top spot. Curiously, everyone’s average years president if president are down though. (I think your methods have changed since that 2015 post.) I get that you’ve always only been averaging their non-zero results from the simulations, so as their odds of becoming president climb, a steady average term if president really counts as an increase in expected time as president. But even Bednar has seen his odds stay the same (70->71%) while his time as president has decreased (10.2->8.6). Maybe I just need to think more about this. Would median time as president if president make more sense than average? Or would it even be materially different?
I’m still dying to look through the individual simulations. Is there one where everyone dies in the order they were ordained, so everyone get to be president but only for two years each? Is there a scenario where Bednar hits 20 years? Is there one where the line goes Nelson->Eyring->Cook->Gong? Is there one where 4 apostles die in the same year? More? Or what happens if Nelson makes it to 110? (I’m not above sorting through big stacks of data looking for curious things . . . .)
Thanks for your comments, everyone. Quentin, I agree that Holland seems to be not in very good health. Paul and Old Man, hopefully this gives you some comfort, as it will really open the door for an Uchtdorf presidency.
Nathan, sorry I’m not an actuary either, but I’m figuring they would point out emphatically that mortality tables are built to describe and predict death rates for groups of people, and applying them to individuals like I’m doing here is pretty sketchy. (I do have a good friend who’s an actuary, and he’s advised me a little on this work, but he generously doesn’t comment on the overall validity of the exercise. I assume he realizes it’s mostly just for fun and speculation.)
DaveW, that’s an interesting exercise to compare from what I posted in 2015. FWIW, the method is pretty much identical. I’m guessing that the decrease you note in average years president if president is just an effect of aging. Say a Q15 member is 75. His average years president if president is 4, but that’s from a bunch of values of 2, 3, and 4, and fewer higher outliers of 6, 7, or 10. Now it’s five years later and he’s 80. The scenarios that he’s missed out on are going to be disproportionately the longer ones, that is, more of the 10’s than the 2’s. That’s just my guess of course. I’m looking at doing another post with the tables that looks backward at how well they’ve predicted for Q15 members who have already died, and I think I might be able to answer your question better when I do that. Also, on the odd outcomes, now that I’m running monthly they’re much more possible. I’ll email you the raw results so you can take a look. I’d love to hear what you find!
Oh, and also, you’re spot on about the months in the future not being a good label on the X-axis. I’ve replaced it with calendar month for the first two graphs in the post.
Holland was wheeled off the stage at the October conference,and spoke of having spent 3 of his 5 recent weeks in the hospital comatose,so the lengthy presidency that may have seemed in the cards for him when Hunter ordained him as an Apostle eight years younger than any incumbent back in 1994 should by no means be counted on.(Richard L. Evans,born 1906,was the first apostle born after Mark E. Petersen,born 1900,but died during the presidency of JFS Jr. who was born in 1876,and decades before his last senior,Ezra Taft Benson,died creating the vacancy filled by Holland).
I see there is a 5-year 10% survival rate attributed to age 100…at age 110 and over (a particular study of mine for many years) 10% survival is more like 3 years,and the most common traced cause of death is amyloidosis.
I don’t think any 100-year-old has occupied a position of influence greater than Nelson’s,and if there’s any institution designed to eventually be led by a 110-year-old,it’s the LDS Church.
These records always interest me. Despite the fact that President Oaks is 92 years old, I think he will become the president of the church. In the last general conference in April, President Nelson appeared only in the last session. And his speech was pre-recorded and with interruptions. I also do not think that Holland and Eyring will ever become presidents. I guess that after Oaks, Uchtdorf will go after him, Bednar. I guess that they, along with Stevenson, have the most chance of becoming counselors. By the way, I wonder how many of the current Q15 are future/current presidents of the church. In 1964, there were as many as 8: David O McKay, Joseph Fielding Smith, Harold B Lee, Spencer W Kimball, Ezra Taft Benson, Howard W Hunter, Gordon B Hinckley and Thomas S Monson.