As the Church rushes to build ever more temples for a membership that’s now growing only slowly, the GAs must face the question of whether new temples are actually bringing in new patrons. Because that’s the goal, I would think: to make the temple accessible to members who couldn’t get to it before.
When a temple is first built in a place, a country or a region of a large country, it should draw in many new patrons who couldn’t attend (or at least couldn’t attend regularly) before. In large countries like Brazil or countries where travel may be difficult like The Philippines (I’m just guessing, with all the islands), it makes sense that building temples in different regions would make temple attendance accessible to more members. But at some point, when most members who want to go can go, a new temple is likely to just redirect temple patrons from one to another rather than actually bringing in anyone new.
Utah is the obvious place where this point of diminishing returns for new temples is coming, if in fact it hasn’t already arrived. I thought it would be interesting to take a look at attendance there as a preview for what might happen as more and more parts of the world approach a point of temple saturation.
Between April and December of last year, on a nearly daily basis, I checked the number of available seats for endowment sessions in each temple in Utah for the next day. I also checked the number of available seats for sessions a month or two in the future to get an idea of each session’s capacity. (And to account for the fact that a few seats are scheduled even a month or two out, I took the capacity for each session as the maximum of any capacity for a session on the same day of the week and at the same time on any day within 60 days of the day of the session.) I then took the difference between capacity and seats remaining the day before as the number of endowment session patrons.
I originally planned to show graphs of daily patron counts, but there’s so much variation within weeks that it’s hard to see trends, so I’m going to show weekly counts instead. Also, to make the data easier to look at, when a temple was closed for just one day (like July 4th) or for the few days when I missed gathering data, I filled the day in with the average for the same day of the week within 30 days in the past or future.
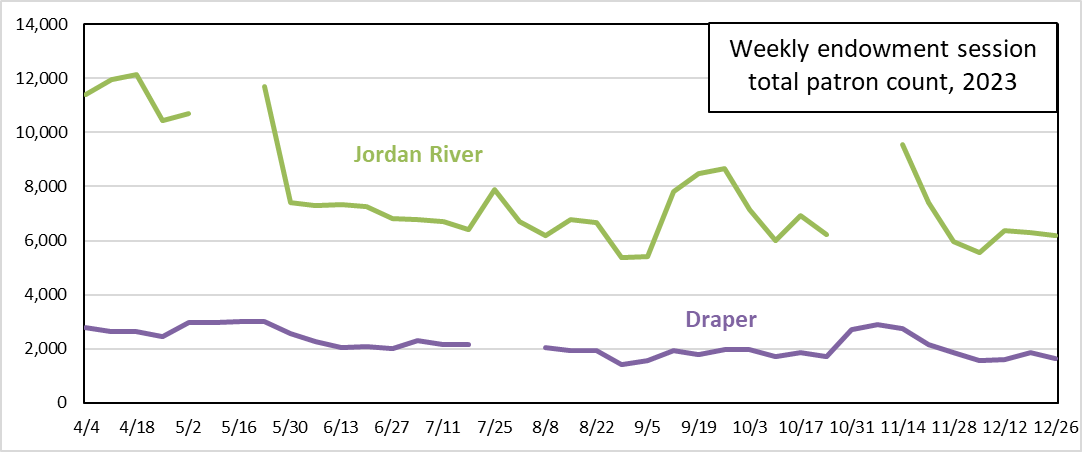
Because the question I’m interested in is the effect of one temple on another nearby, I’ll show a few pairs of nearby temples. Here are Jordan River and Draper.

Both temples show increased attendance when the other closed. In May, when Jordan River closed, Draper’s weekly counts went from about 2600 to about 3000. And again in October, its weekly counts went from about 1800-1900 to about 2800. On the Jordan River side, when Draper closed in July, its weekly count went from the range of 6000-7000 to nearly 8000.
There are other interesting trends to see here too, like that when Jordan River re-opened after being closed, both times it experienced a big spike in patrons that then quickly dropped off. Also, overall, both temples look like they had maybe a decline in attendance through the year. I wonder if this is a typical seasonal trend, where people make a New Year’s resolution to attend the temple more, and then life interferes and attenuates their attendance until the beginning of the next year reminds them to try to attend more. I really have no idea, though. More data could help me answer this if I get around to gathering it.
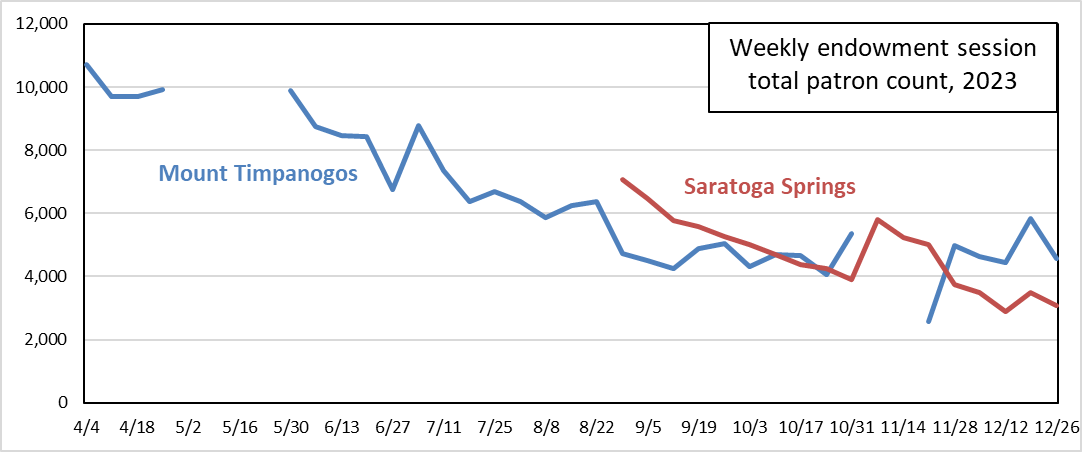
Here are Mount Timpanogos and Saratoga Springs:

Saratoga Springs wasn’t just temporarily closed, but rather was first opened during 2023. When it opened, Mount Timp’s weekly counts fell from the range of 6000 or more to nearer 5000 or even less. And on the other side, when Mount Timp closed in November, Saratoga Springs had a temporary increase in counts, from below 4000 up to nearly 6000.
Also, unrelated to my main question, it’s interesting to see that Saratoga Springs had weekly declines in patron counts for its first ten weeks open, going back up only when Mount Timp closed. This isn’t really surprising, but it is interesting to see the process of a newly-opened temple drawing crowds at first and then the crowds diminishing with time. And on the possibility of generally decreasing attendance through the year, Mount Timp appears to be an even clearer example than Jordan River or Draper in the previous graph.
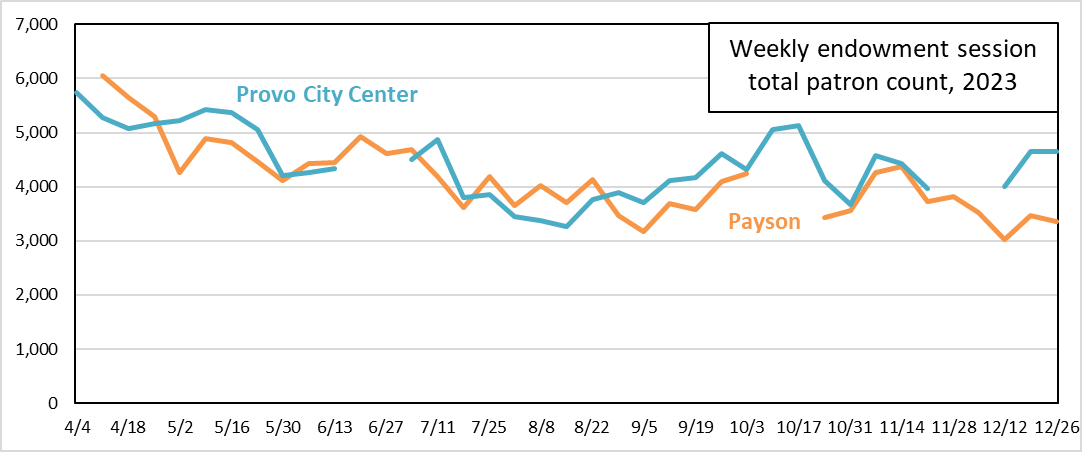
Finally, here are Provo City Center and Payson: 
When Provo City Center was closed in June, Payson had an increase from less than 4500 patrons a week to nearly 5000. When it was closed again in November and December, though, Payson didn’t have an obvious increase. On the other side, when Payson was closed in October, Provo City Center increased from 4000-4500 to over 5000 for a couple of weeks.
But, you’re probably objecting as you look at these graphs showing temples in pairs, temples in Utah are far too close together for one temple’s closure to affect only one other. When Jordan River closes, shouldn’t it also affect Oquirrh Mountain? And Mount Timp? And Saratoga Springs? And heck, maybe even Bountiful?
To answer this concern, and to more formally try to estimate how many patrons who typically attend one temple instead attend another one nearby when their typical one is closed, I ran a series of regression models. If your eyes glaze over at the mention of stats, you might want to skip the next paragraph, but if you bear with me, I’ll try to be as brief and clear as I can.
I ran one model for each temple in northern Utah. I included only these temples because they are close enough that patrons are likely to switch between them when one is closed. (This is unlikely to be true for Vernal and Monticello. I also excluded Cedar City and St. George because although patrons clearly switch between the two when one is closed, St. George was closed for nearly the entire year.) Each model predicted the daily endowment session patron count for one temple (the dependent variable) from (1) its total number of endowment session seats for the day, (2) a set of dummy codes for days of the week, and of central interest (3) another set of dummy codes indicating whether nearby temples were open or closed. The total seats and days of the week variables were just to control for those effects, so I could more precisely get at the effects of nearby temples being open or closed. In each model, I dropped any variables that did not achieve statistical significance (p < .05). (Statistical significance just means that given the variability in the data, the variable’s effect was big enough that it seemed unlikely to occur by chance alone if the variable’s true effect were zero.) What’s nice about using dummy codes for nearby temples being open or closed is that the expected increase in patrons for the temple whose patron count is the dependent variable.
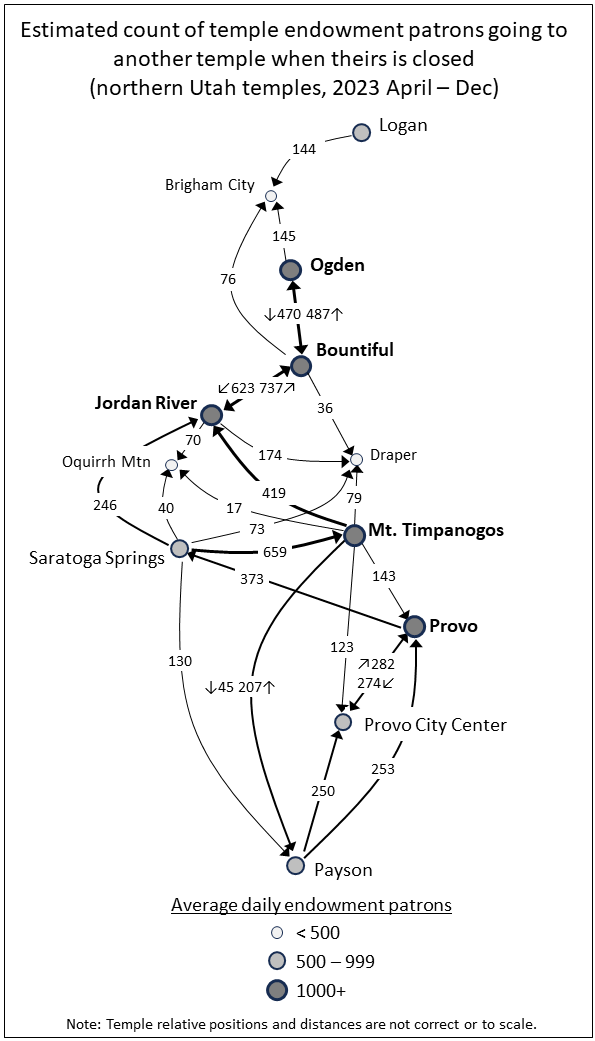
This next graphic shows the results. Note that I was pretty generous in including temples in the “nearby” list for each temple, but the farther away ones always failed the test of statistical significance. Also note that while I’ve arranged the temples roughly where they are geographically, nothing is to scale, and I had to push some of them around to make the graphic easier to draw.
Anyway, what’s being shown here is just the estimated count of people who typically attend one temple going to another when their primary temple is closed. So, for example, when Logan is closed, 144 of its usual patrons go to Brigham City. There’s no corresponding number going in the opposite direction because the effect of Brigham City being closed on Logan’s patron count wasn’t statistically significant. The true count is almost certainly not zero, but it’s probably just easier to detect the effect of a big temple on a nearby small temple than the reverse. Along the same lines, looking further down in the graphic, the smaller temples Oquirrh Mountain and Draper have arrows pointing in from other temples sending patrons when closed, but no arrows pointing out for these temples sending patrons to other temples when they’re closed.

Anyway, the actual values in the graphic are certainly wrong and incomplete in many ways in addition to the problem of estimating the effects of smaller temples being closed. That Mount Timp received 659 patrons when Saratoga Springs was closed (or not yet open) but sent zero to Saratoga Spring when it was closed seems unlikely, especially given the second line graph above. It probably just means that both temples had so much day-to-day and even week-to-week variability in patron count that it was difficult to statistically detect a pattern against the noise.
But getting back to my original point, I think what’s really interesting here is that at least some, or perhaps even many temple patrons are able to go to a different temple when their usual temple is closed. So when a temple is temporarily closed, the decrease in total number of temple patrons across northern Utah is less than just subtracting the temple’s usual daily patron count. This is good news for the Church getting a lot of temple attendance. But the other side of the coin is that it also means that building new temples close to all these existing temples will increase total patron count less than the total patron count of the new temple. New temples won’t be so much bringing in members who previously weren’t able to attend the temple. They’ll just be redirecting patrons from one temple to another.
For example, consider the Lindon Temple. It’s unlikely to be bringing in brand new patrons who couldn’t attend the temple before. Instead, it will redirect patrons from Orem (which wasn’t included in my analyses above because it didn’t open until 2024) or Provo or Mount Timp or Saratoga Springs. The same goes for Taylorsville and Layton and Syracuse and perhaps also to Red Cliffs and Desert Peak, all temples either under construction or close to opening in Utah.
From the graphic above, I added up each temple’s average daily patron count. Then I also added up the estimated counts of patrons sent to other temples when the temple was closed. For example, Ogden averaged 1121 patrons on days it was open, and it sent 615 patrons to other temples when closed (470 to Bountiful plus 145 to Brigham City). This means an estimated 615 / 1121 = 55% of regular patrons of the Ogden Temple went to other temples when it was closed. When I summed these up for all the northern Utah temples, the result was 61%. The true value is probably higher: recall that dropping variables that weren’t statistically significant meant that Oquirrh Mountain and Draper and Brigham City sent an estimated zero patrons to other temples when closed. As more temples are built, this percentage will increase toward 100%, but ever more slowly, and the increase in total attendance from each new temple in the same area will become smaller and smaller. And what has begun in Utah will start happening anywhere there’s a concentration of Church members and multiple temples. The first temple built in an area will dramatically increase access to the temple and therefore likely temple attendance. But each new temple that’s built fairly close by will increase marginal attendance less and less.
This is awesome!
I’m curious whether you had to collect all of this data manually, or whether there’s a way to write a program to do it for you. It seems very tedious, but I guess sometimes you have to suffer for your art, or something like that.
It might be interesting to plot the geographic distances between neighboring temples against the number of temple patrons who travel between them. I’m also interested in whether it’s possible to estimate some kind of a “gain factor” for building a new temple near another. A gain of 1 would mean most of the attendees are net new, and a gain of 0.1 would mean it’s only creating 10% of the utility of a brand new temple in a more remote location. Of course probably someone in the church office building does this already, but they aren’t exactly sharing with us, so we do what we have to!
fascinating! I know with the Salt Lake temple closed for so long, redirecting downtown patrons to either Bountiful or Jordan River, my parents’ stake downtown (full of retirees and temple workers) has actually seen a reduction in population by half over the past few years. It doesn’t make sense for the temple workers to not have a temple nearby, so they’ve moved elsewhere.
These are interesting questions, and I love the temple substitution network graph. I am not sure how good a proxy reservations are for attendance. When the Washington DC temple opened after a 4-year closure, the reservation slots were full for weeks. The temple presidency advised the temple district to come anyway because some who reserved slots did not end up attending and seats were available. I tried what the presidency said and found that it was so. Then after the collective pent-up desire to return to the Washington DC temple had been sated, I generally stopped bothering with online scheduling. Counts of reservations are what can be observed, though, and that is better than nothing. I suspect that reservations predict attendance by the young better than attendance by older temple-goers.
Very cool! At Provo, I’ve noticed that a fair number of attendees perhaps 1/4 or more do not have a reservation from week to week. I’m guessing a good fraction of those folks were temple ordinance workers based on a few interactions. My data is of course only anecdotal and usually from a morning hour.
So interesting! It’s just make me think of so many more questions! ?
For example, what is the top capacity for each of the temples? When the Jordan River temple is getting like 12k visitors per month at the very peak of attendance, is there still room for more or is that the max?
Because if there’s plenty of room still, why on earth spend hundreds of millions of dollars to build all these new temples? Shouldn’t the people in my ward in Lehi be willing to drive ten extra minutes to the Mt. Timpanogas temple in order to give $75 million to humanitarian aid in a developing nation?
Because if there’s plenty of room still, why on earth spend hundreds of millions of dollars to build all these new temples?
It’s a peak demand issue. 12K visitors per month is certainly not the capacity because you will have empty seats during the off-peak at any temple. They want to accommodate peak demand, but doing so inevitably creates more empty seats during the off-peak. (As an economist, I would point out that the way to fix this would be to charge admission during the peak period, but not during the off-peak. A lot of transportation modes regulate demand in a similar way. But that is obviously a nonstarter for the temple.)
Ziff, if you decide to pursue some of Quentin’s ideas, I could probably spare some time to help with data collection.
Based on what I see working in Gilbert, less than half of our Patrons have appointments.
I’ve heard, but don’t know if it’s true, that sometimes new temples are built to better accommodate the youth doing baptisms rather than the sessions for adults. At least I heard about one stake presIdent who let them know in SL that the youth in his stake couldn’t always get in during the hours they were available to do baptisms with the long lines, etc. Of course, I would think it would be more cost effective to add another font or two rather than build new temples, but maybe the design of the buildings didn’t accommodate that.
Thanks, everyone, for your comments.
Quentin, yeah, I gathered the data all manually. A friend of mine told me they might be able to help out in making the process a little more automated. The Church’s temple scheduling setup is of course designed for temple patrons rather than for people like me, so I’d still have to run the process every day if I wanted to get the best sense of daily patron counts. And your idea about the possible patron gain associated with a new temple is awesome! I’ll have to think more about it and see if there’s anything like that I can come up with, either with the data I already have, or with new data. Because I already was looking at driving distances between temples to decide which ones were close enough to include in the regression models.
acw, John Mansfield, wvs, and sd, I really appreciate getting your experiences on use of the online scheduling system. Of course in any work I do with the data I have, I’m ignoring people walking in without appointments. I meant to mention this in the post as a huge caveat to drawing any conclusions from what I’ve done, but clearly it slipped my mind! Thanks for bringing it up.
Abby Hansen and Last Lemming, that’s a great question about utilization. I’m thinking I might be able to put something together with the data I have to look at average and peak utilization by temple and by groups of nearby temples. And Last Lemming, thanks for your offer of help on the data collection. I’ll reach out if I could use a hand!
L, that’s a super interesting point I hadn’t thought of. I’ve done a few posts on temple activity, and I’ve always focused on endowment sessions because they’re the ordinance that takes the longest, and also kind of the default one: if someone says they’re going to the temple, with no more information I’d assume they’re going to do endowments. But that’s a great thought that I should consider looking at how busy scheduling is for other ordinances, because if baptisms in particular are a consideration as you point out may be the case, then I’m missing the whole picture by just counting endowment patrons.
Besides endowments and baptisms for the dead another factor may be weddings. About seventeen years back I attended a sealing in the Bountiful temple. The Jordan River, Salt Lake, Mt. Timpanogos, and Provo temples were all closer to the bride’s parents’ home in the south part of the Salt Lake valley and the park near their house where the reception was held in the afternoon, so I asked why the Bountiful temple had been selected. The simple answer was that that was the closest one with an available sealing room when the couple scheduled. That day is something I have kept in mind as numerous additional temples have been built in Utah. Peak utilization, as Last Lemming wrote.
The Jordan River temple now has a special exit in the back of the temple for just-married couples, and their families and friends wait back there for them. It fits that temple’s work horse quality, but I have always liked seeing the wedding parties in front of the temple. It is nice to catch glimpses of people enjoying an enjoyable occasion.
Thank you for your hard work and patience in compiling these statistics. Impressive.
Thanks, Red! I’m glad you enjoyed the post.
Love the graphs in this post. Really nice analysis.
Thanks, Brian! I’m so glad you enjoyed it!