I blogged a few days ago about which books of scripture Quorum of 15 members cite more or less frequency in Conference. BethSmash asked to see results for women leaders.
Unfortunately, getting trends over time for the women leaders requires more work than I have the energy for right now. I would need to get not only distribution of citations by book of scripture for each person, but for each person in each year. Sorry, BethSmash! But I did get counts of citations for each person ignoring when the talk was given, and I’ve done the same adjustment I did for the Quorum of 15 members in the other post, adjusting for the prevailing citation norms at the times the people were in their callings. I’ve put these in this post, in case they’re of any interest.
I looked in the LDSSCI for citation counts for all members of a Relief Society, Young Women’s, or Primary General Presidency since the mid-1970s. I didn’t look back any further because if I remember right, women didn’t speak regularly in Conference before the 1980s, and there weren’t General Women’s meetings (which the LDSSCI includes) before the late 1970s.
Here are counts for all RS, YW, and Primary Presidency members who had at least 10 scripture citations in their talks (regardless of how many talks it took them to use that many references). There are 42 women who meet this criterion. I’ve put them in order by calling year.
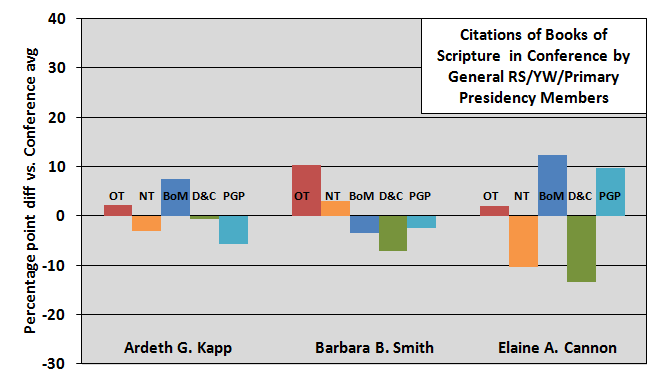
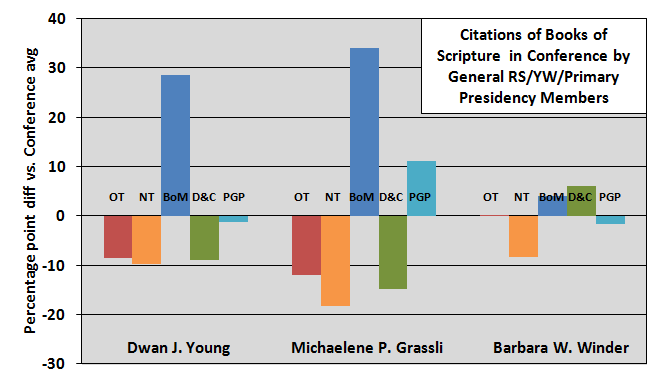
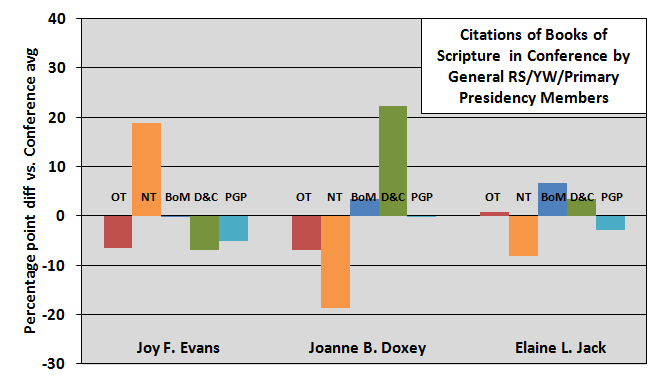
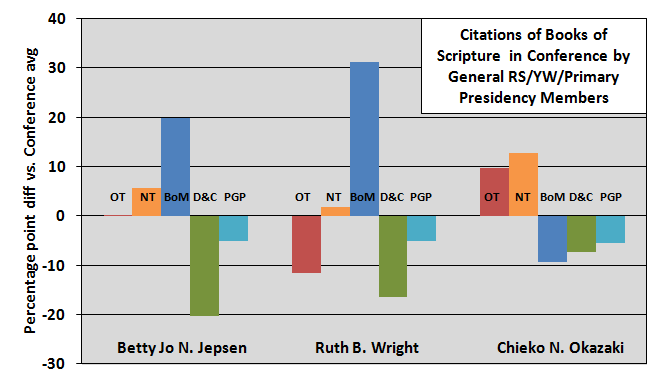
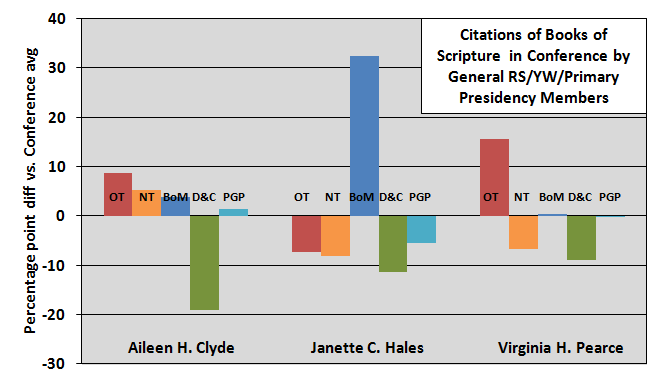
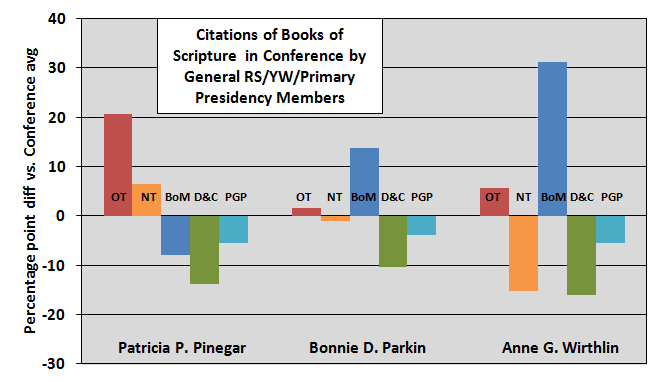
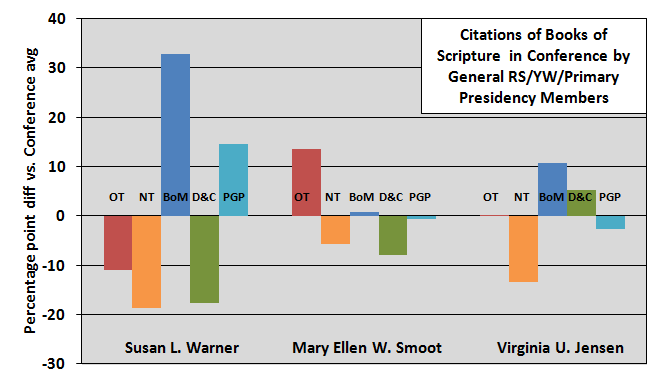
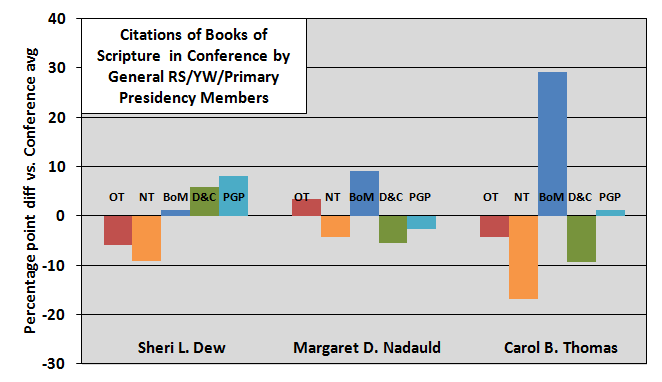
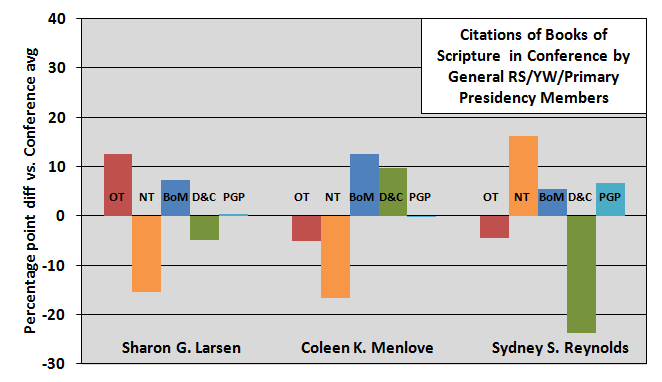
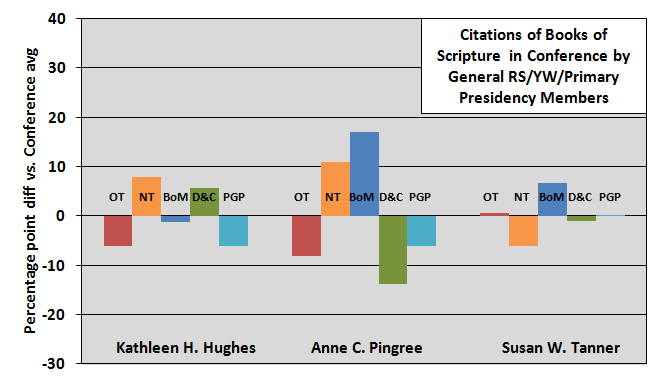
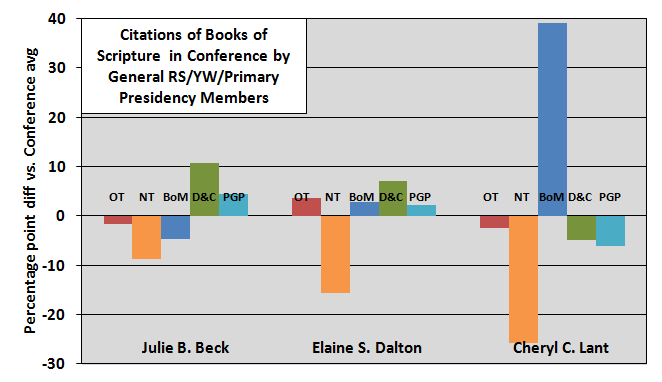
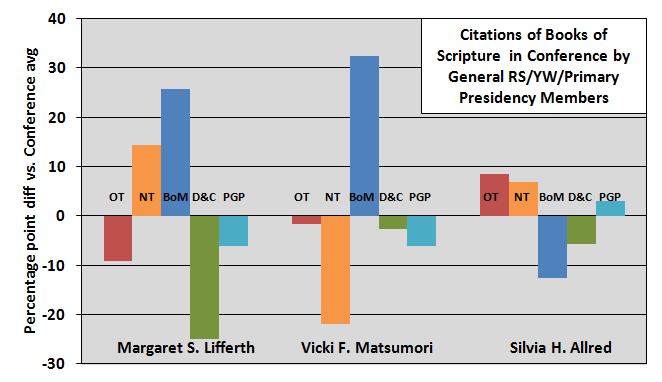
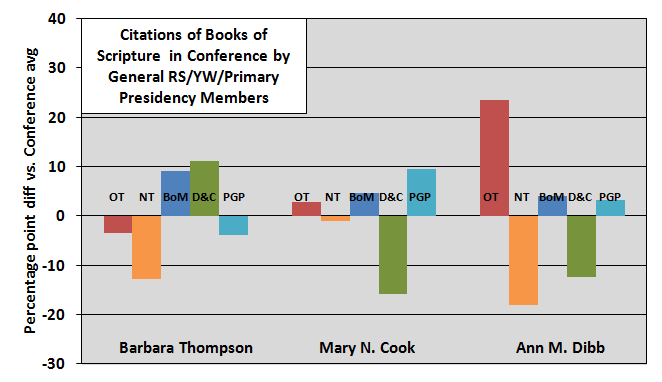
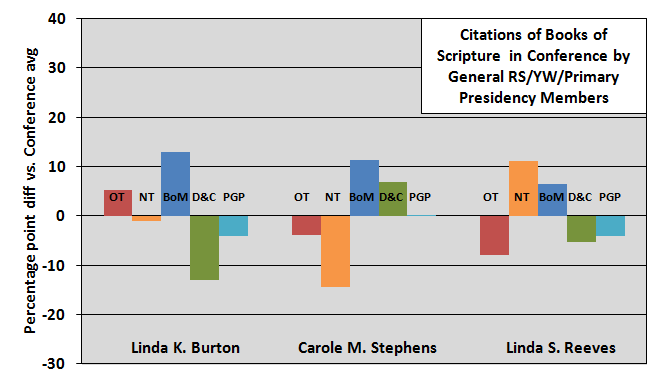 There’s a lot more variability in the women than there are in the Quorum of 15 members in the other post. Note that I had to increase how far out the vertical axis goes quite a bit to accommodate the longest bars. But this result is primarily a function of their small sample size: none of these women have given enough talks (even counting RS and YW and General Women’s sessions, which LDSSCI does) to amass as many scripture citations as the Q15 members. And of course, with fewer talks and fewer citations, they have fewer chances to cover the range of possible scriptures they might cite. If you look at the counts in the tables below, it does appear that the women who have fewer total citations are more likely to have extreme values in the graphs.
One thing I thought it might be interesting to look at is a summary by organization. Note that for this graph, women who served with more than one organization (e.g., Julie B. Beck served in both the YW and RS General Presidencies) are counted for neither one; only women who served with just one organization are included.
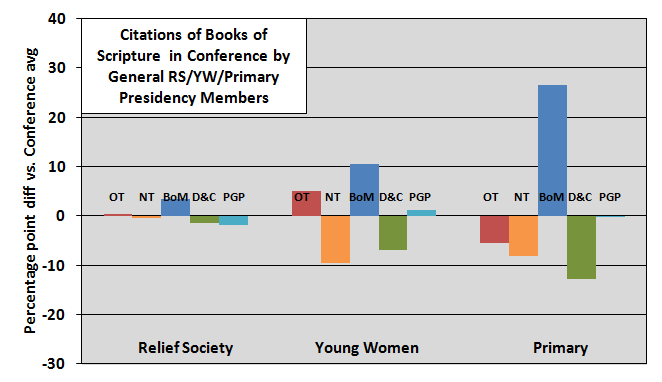 This is a really interesting trend: General RS Presidencies cite scriptures pretty much like the average Conference speaker of their time, but YW Presidencies emphasize the Book of Mormon more (at the expense of the New Testament and D&C), and Primary Presidencies emphasize the Book of Mormon to an extreme amount (at the expense of all other books of scripture). I wonder if this means that in some sense we think of the Book of Mormon as the easiest for teens and children to grasp. Or maybe it has the most straightforward stories? I don’t know. I’m just guessing. I’d love to hear your theories in the comments.
Here is the raw data in case you’re interested in it.
| Counts | ||||||
|---|---|---|---|---|---|---|
| Member | OT | NT | BoM | D&C | PGP | Total |
| Ardeth G. Kapp | 3 | 6 | 6 | 5 | 0 | 20 |
| Barbara B. Smith | 14 | 23 | 8 | 12 | 2 | 59 |
| Elaine A. Cannon | 3 | 5 | 6 | 3 | 3 | 20 |
| Dwan J. Young | 1 | 6 | 14 | 4 | 1 | 26 |
| Michaelene P. Grassli | 0 | 4 | 19 | 3 | 5 | 31 |
| Barbara W. Winder | 7 | 12 | 21 | 17 | 2 | 59 |
| Joy F. Evans | 1 | 9 | 6 | 3 | 0 | 19 |
| Joanne B. Doxey | 1 | 2 | 7 | 9 | 1 | 20 |
| Elaine L. Jack | 13 | 23 | 40 | 30 | 3 | 109 |
| Betty Jo N. Jepsen | 3 | 9 | 13 | 1 | 0 | 26 |
| Ruth B. Wright | 0 | 4 | 8 | 1 | 0 | 13 |
| Chieko N. Okazaki | 10 | 20 | 9 | 8 | 0 | 47 |
| Aileen H. Clyde | 15 | 26 | 24 | 4 | 5 | 74 |
| Janette C. Hales | 1 | 5 | 14 | 3 | 0 | 23 |
| Virginia H. Pearce | 10 | 9 | 11 | 6 | 2 | 38 |
| Patricia P. Pinegar | 6 | 7 | 4 | 2 | 0 | 19 |
| Bonnie D. Parkin | 6 | 14 | 22 | 7 | 1 | 50 |
| Anne G. Wirthlin | 2 | 2 | 7 | 1 | 0 | 12 |
| Susan L. Warner | 0 | 2 | 9 | 1 | 3 | 15 |
| Mary Ellen W. Smoot | 10 | 10 | 13 | 6 | 2 | 41 |
| Virginia U. Jensen | 4 | 6 | 15 | 10 | 1 | 36 |
| Sheri L. Dew | 4 | 17 | 26 | 23 | 11 | 81 |
| Margaret D. Nadauld | 5 | 9 | 14 | 6 | 1 | 35 |
| Carol B. Thomas | 1 | 2 | 9 | 2 | 1 | 15 |
| Sharon G. Larsen | 8 | 5 | 13 | 6 | 2 | 34 |
| Coleen K. Menlove | 1 | 2 | 8 | 6 | 1 | 18 |
| Sydney S. Reynolds | 1 | 7 | 6 | 0 | 2 | 16 |
| Kathleen H. Hughes | 1 | 9 | 8 | 8 | 0 | 26 |
| Anne C. Pingree | 1 | 20 | 26 | 6 | 0 | 53 |
| Susan W. Tanner | 8 | 16 | 30 | 19 | 5 | 78 |
| Julie B. Beck | 12 | 27 | 41 | 53 | 15 | 148 |
| Elaine S. Dalton | 27 | 24 | 71 | 66 | 16 | 204 |
| Cheryl C. Lant | 1 | 0 | 11 | 3 | 0 | 15 |
| Margaret S. Lifferth | 0 | 4 | 6 | 0 | 0 | 10 |
| Vicki F. Matsumori | 2 | 1 | 18 | 6 | 0 | 27 |
| Silvia H. Allred | 9 | 17 | 10 | 10 | 4 | 50 |
| Barbara Thompson | 5 | 12 | 35 | 31 | 1 | 84 |
| Mary N. Cook | 5 | 11 | 15 | 4 | 6 | 41 |
| Ann M. Dibb | 20 | 6 | 22 | 8 | 5 | 61 |
| Linda K. Burton | 4 | 9 | 13 | 4 | 0 | 30 |
| Carole M. Stephens | 1 | 4 | 10 | 8 | 1 | 24 |
| Linda S. Reeves | 0 | 8 | 7 | 4 | 0 | 19 |
Here are the comparison percentage for each woman’s years in her calling.
| Conference average percentages (all speakers) | |||||||
|---|---|---|---|---|---|---|---|
| Member | Enter | Exit | OT | NT | BoM | D&C | PGP |
| Ardeth G. Kapp | 1972 | 1992 | 13% | 33% | 23% | 26% | 6% |
| Barbara B. Smith | 1974 | 1984 | 14% | 36% | 17% | 27% | 6% |
| Elaine A. Cannon | 1978 | 1984 | 13% | 35% | 18% | 28% | 5% |
| Dwan J. Young | 1980 | 1988 | 12% | 33% | 25% | 24% | 5% |
| Michaelene P. Grassli | 1980 | 1994 | 12% | 31% | 27% | 25% | 5% |
| Barbara W. Winder | 1984 | 1990 | 12% | 29% | 32% | 23% | 5% |
| Joy F. Evans | 1984 | 1990 | 12% | 29% | 32% | 23% | 5% |
| Joanne B. Doxey | 1984 | 1990 | 12% | 29% | 32% | 23% | 5% |
| Elaine L. Jack | 1987 | 1997 | 11% | 29% | 30% | 24% | 6% |
| Betty Jo N. Jepsen | 1988 | 1994 | 12% | 29% | 30% | 24% | 5% |
| Ruth B. Wright | 1988 | 1994 | 12% | 29% | 30% | 24% | 5% |
| Chieko N. Okazaki | 1990 | 1997 | 12% | 30% | 29% | 24% | 5% |
| Aileen H. Clyde | 1990 | 1997 | 12% | 30% | 29% | 24% | 5% |
| Janette C. Hales | 1990 | 1997 | 12% | 30% | 29% | 24% | 5% |
| Virginia H. Pearce | 1992 | 1997 | 11% | 30% | 29% | 25% | 6% |
| Patricia P. Pinegar | 1992 | 1999 | 11% | 30% | 29% | 24% | 5% |
| Bonnie D. Parkin | 1994 | 2007 | 10% | 29% | 30% | 24% | 6% |
| Anne G. Wirthlin | 1994 | 1999 | 11% | 32% | 27% | 24% | 6% |
| Susan L. Warner | 1994 | 1999 | 11% | 32% | 27% | 24% | 6% |
| Mary Ellen W. Smoot | 1997 | 2002 | 11% | 30% | 31% | 23% | 5% |
| Virginia U. Jensen | 1997 | 2002 | 11% | 30% | 31% | 23% | 5% |
| Sheri L. Dew | 1997 | 2002 | 11% | 30% | 31% | 23% | 5% |
| Margaret D. Nadauld | 1997 | 2002 | 11% | 30% | 31% | 23% | 5% |
| Carol B. Thomas | 1997 | 2002 | 11% | 30% | 31% | 23% | 5% |
| Sharon G. Larsen | 1997 | 2002 | 11% | 30% | 31% | 23% | 5% |
| Coleen K. Menlove | 1999 | 2005 | 11% | 28% | 32% | 24% | 6% |
| Sydney S. Reynolds | 1999 | 2005 | 11% | 28% | 32% | 24% | 6% |
| Kathleen H. Hughes | 2002 | 2007 | 10% | 27% | 32% | 25% | 6% |
| Anne C. Pingree | 2002 | 2007 | 10% | 27% | 32% | 25% | 6% |
| Susan W. Tanner | 2002 | 2008 | 10% | 27% | 32% | 25% | 6% |
| Julie B. Beck | 2002 | 2012 | 10% | 27% | 32% | 25% | 6% |
| Elaine S. Dalton | 2002 | 2013 | 10% | 27% | 32% | 25% | 6% |
| Cheryl C. Lant | 2005 | 2010 | 9% | 26% | 34% | 25% | 6% |
| Margaret S. Lifferth | 2005 | 2010 | 9% | 26% | 34% | 25% | 6% |
| Vicki F. Matsumori | 2005 | 2010 | 9% | 26% | 34% | 25% | 6% |
| Silvia H. Allred | 2007 | 2012 | 9% | 27% | 33% | 26% | 5% |
| Barbara Thompson | 2007 | 2012 | 9% | 27% | 33% | 26% | 5% |
| Mary N. Cook | 2008 | 2013 | 9% | 28% | 32% | 26% | 5% |
| Ann M. Dibb | 2008 | 2013 | 9% | 28% | 32% | 26% | 5% |
| Linda K. Burton | 2012 | — | 8% | 31% | 30% | 26% | 4% |
| Carole M. Stephens | 2012 | — | 8% | 31% | 30% | 26% | 4% |
| Linda S. Reeves | 2012 | — | 8% | 31% | 30% | 26% | 4% |
Note that the women who served in more than one presidency (sometimes in different organizations, e.g., RS and YW) have more than one entry year and more than one exit year. I’ve listed their first entry year and their last exit year.
I wonder if the YW bump for OT comes from referencing the stories of Esther and Ruth; the images of the maiden-queen-heroine and the virtuous-gleaner are pretty central to the values put forth in that program.
Wow. This is great! Thank you.
Also, just looked at a few of my favorite leaders, and they seemed to have the most quotes from the NT, then OT then BOM, then DC… I wonder if that says anything about me?
Coffinberry, I would assume that it’s because the OT contains far more stories in which women are more than merely mentioned. If I were a YW leader I would definitely look to those examples.
Ziff, Just to be clear, is the “conference average” baseline, the average for women speakers or the average for all speakers? I ask because I would like to see how these women compare to the averages for male speakers.
Coffinberry, that’s a really interesting idea! I wouldn’t have thought of that (perhaps because I didn’t go through the YW program).
BethSmash, I find that I also tend to like the speakers who emphasize the Bible more than those who emphasize latter-day scripture. I guess that means that in Mauss’s terms I’m more in favor of assimilation. 🙂
Jeff, it’s the average for all speakers. Just like for the Q15 in the last post, I’m comparing them against all talks given in that same year. (Not even the speakers’ own talks are removed, unfortunately, because doing that would require the hassle of figuring out speaker/year scripture references.)
Loved the post, Ziff!
Great post, Ziff! Next can we see which RS/YW/Primary Presidency members prefer which punctuation marks?
(This snark brought to you by my husband, who wanted attribution.)
(That snark was all me.)
Thanks for your feedback, Petra and Mr. Petra! I’ll be sure to add that to my list of post ideas. 🙂
Besides the stories of Esther and Ruth, the YW program regularly references Proverbs 31 (Virtue). The books Joshua and Job also provide good scriptures to go with the values Choice & Accountability and Integrity.