Back in November, the Church announced a new General Women’s Meeting that will occur the weekend before each General Conference. This meeting will include girls who are eight to eleven years old in addition to women and teenage girls. I saw a number of people on the Bloggernacle suggest that the result would be that either the talks will be over the youngest girls’ heads and therefore boring to them, or the talks will be aimed at them and therefore boring to the women and teens. For example, on the first possibility, here’s Rebecca J at BCC:
Why would you include eight-year-old girls in a women’s conference? . . . Perhaps inviting 11-year-old girls would not be inappropriate—girls on the cusp of Young Woman-hood, as it were. . . . But what do our leaders have to say to grown women that could possibly be relevant and not mind-numbingly boring to eight-year-old girls?
This question got me to wondering whether I could measure to what degree Conference speakers were pitching their talks differently to differently-aged audiences. I’m sure there’s an in-depth way to answer this question that requires analyzing the actual content of Conference talks. But as you can probably guess, I didn’t go that route. Instead, I took a shortcut and looked at a related question that I could answer more easily. I looked at whether Conference talks differ in how difficult their language is, depending on which session they’re given in, and therefore the age of the audience they’re aimed at.
I took the texts of all 3119 Conference talks given between 1971 and 2013 and scored them for reading difficulty using the tool at readability-score.com. I included all the Relief Society and Young Women’s sessions that aren’t technically part of Conference, because these were my best data points given that their audiences have narrower age ranges than any of the general sessions (or the priesthood session). One step I did have to take before scoring the talks was to take out everything in parentheses. Speakers vary in how they cite sources: some have references in parentheses and others use footnotes. The footnotes were easy to exclude, but the parentheses really messed up the scoring. In many cases it appears that references in parentheses were counted as whole extra sentences, which wasn’t good because the readability scoring is partly a function of sentence length. So that’s why I took out anything in the talks that appears in parentheses.
The reading difficulty tool gives scores on several different readability measures. The measures are all highly correlated, so they are likely to give similar results. I chose to use the Flesch-Kincaid (FK) grade level score because it was listed first. I chose the grade level score over the reading ease score because grade level is likely an easier scale to understand. We’ve all been in school, so we have a sense of the difference between writing understandable to sixth graders and writing understandable to tenth graders.
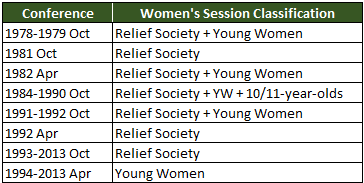
I also had to put the sessions into categories. For general sessions and priesthood sessions, this was trivial, but for some of the women’s or young women’s sessions in the 1970s and 1980s, it wasn’t always clear what exactly the audience for the session was. I had to look at who speakers addressed when they opened their talks, and sometimes at notes helpfully inserted at the beginning of talks (I assume by Ensign editors). Here’s how I classified each of the women’s/young women’s sessions. Please let me know in the comments if I’ve gotten any of them wrong.
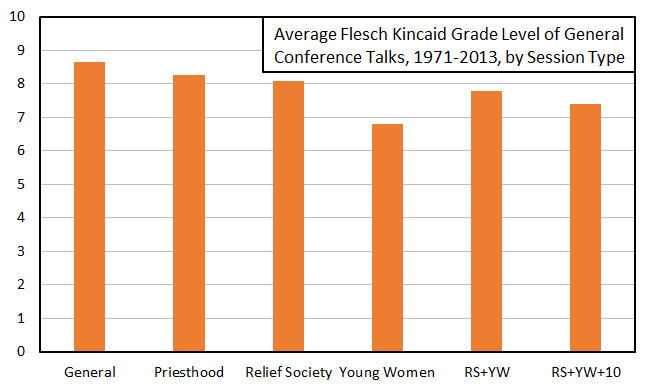
Once I had all the sessions categorized, I calculated the average FK grade level for talks in each type of session. Here are the results:
 It looks like talks in general sessions are the most complex (highest FK grade level on average), with Priesthood and Relief Society sessions being slightly less complex. Talks in Young Women’s sessions are noticeably less complex. When RS and YW are combined, the talk complexity falls between the RS alone and the YW alone, and when the 10 and 11-year-olds are added, the complexity goes down a little from RS+YW.
It’s odd to me that general sessions have higher complexity than Relief Society sessions, since the latter have an audience of adults only and the former include everyone. The same could be said of Priesthood sessions, since they exclude children while general sessions include them. It may be that Priesthood session talks are more often addressed to teenagers than are general session talks. Certainly that’s my impression, but I haven’t checked.
Looking just at the women’s sessions, the pattern makes more sense: the older the audience, the more complex the talks. This result supports the concern raised by Rebecca J and others. When 8-year-olds are invited to the women’s session, it seems likely that the talks will be simplified to be comprehensible to them, and therefore less engaging to older attendees.
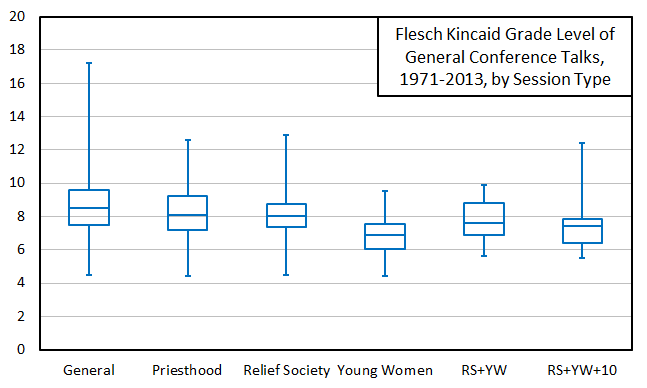
Let me show you one more graph before I wrap up. This one may require a little bit of explanation if you haven’t had a stats class recently. It’s called a boxplot. For each session category, rather than showing just one value (the average), it shows five: the minimum, the 25th percentile, the median, the 75th percentile, and the maximum.
The minimum and maximum are straightforward to find: line up the FK scores for a session category in order from smallest to largest. The first one in order is the minimum and the last one is the maximum. The other three values also come out of this lining up of the scores. The median is the score that’s halfway through the list. The 25th percentile is the score that’s 25% of the way through the list; the 75th percentile is the score that’s 75% of the way through the list. (As you can probably guess, this means the median can also be called the 50th percentile.)
Then it’s just a matter of putting each of the five scores for each session type in the boxplot. The median is the middle horizontal line in the middle of the box. The 25th percentile is the bottom of the box. The 75th percentile is the top of the box. The minimum is the short horizontal line below the box that has a vertical line extending out to it; the maximum is the short horizontal line above the box that also has a vertical line extending out to it. (Note that this is just one type of boxplot; see the Wikipedia link to read about more.)
Here are the boxplots.
One thing this graph emphasizes that the previous one misses is how much variability there is in complexity of talks within each type of session. It’s not as though every RS session talk is more complex than any YW session talk. It’s just a general tendency for RS session talks to be more complex. This graph also allows more complete statements like that over 75% of YW session talks are less complex than the median RS session talk (because the top of the YW box–the 75th percentile–is below the middle of the RS box–the median). The same is true of the RS+YW+10 sessions: over 75% of talks are less complex than the median RS session talk.
I don’t think this graph changes the story. It still seems likely that speakers will pitch their talks to younger girls and miss the women. I’ll be interested to see what the first new format women’s session is like, though. One fact does encourage me: I hadn’t realized before doing this that the age cutoff for women’s meetings had been changed so much before. I didn’t remember that 10- and 11-year-olds had ever been invited. This gives me hope that if including the 8-year-olds doesn’t work, the age cutoff might be moved again.


Cool analysis, Ziff! I find it interesting that the boxes (the interquartile ranges) for all sessions are pretty similar–they seem to land between 6th and 10th grade. I think that is pretty good if you are trying to make talks accessible to a wide audience. At work when we write for lay audiences we have to make sure that the writing is no higher than 8th grade level, and lower levels are considered preferable.
On the other hand, what does it say that the talks are targeted towards middle-school age comprehension? Certainly middle-schoolers seem the demographic least likely to want to pay attention to what is said in General Conference.
Finally, I’m curious as to whether there were particular speakers who were consistently near the top or bottom of the reading-level scale. For example, who was at 17th grade level? Seems like it had to have been Neal A. Maxwell. Or one of Dallin Oaks doctrinal talks?
This is really interesting. Great work!
How significant is the variability between the general sessions, priesthood and Relief Society? They all seem pretty close to an 8 average so I wonder if the difference is actually significant/noticeable?
Also, I am guessing some of those higher scores in the general sessions are caused by certain speakers known to be more complex in writing and speech (Elder Maxwell) who didn’t often speak in other sessions, so I hypothesize the difference is even less significant.
This explains a lot. Thanks for another useful and awesome graphic, Ziff!
Thanks, Mike, Daniel, and Melody. And y’all have already hit on the gaping hole in my approach: it’s not the same mix of speakers speaking at the different sessions. I thought about trying to control for this, but unfortunately there are only a tiny number of people who have given any significant number of talks at the different types of sessions. Basically Julie Beck (since she was in multiple presidencies) and some First Presidency members.
Absolutely no suprise that the largest spread on the boxplot is in general sessions. Elder Maxwell never gave his most complex talks in Priesthood session and there have been a lot more and varied speakers in general sessions. The most suprising to me is the narrow distribution in the middle half of Relief Society talks. A grand total of 1.5 grades for half of those talks. Then again, there have been few women who have been totally career women in the RS presidency. Sister Dew and Sister Thompson are two recent examples, but they have probably aimed the talks at the 9th-11th grade level mostly.
Also, Ziff can you do a breakdown on the different sessions of general conference? I would think that Saturday afternoon would have the highest average, since the least amount of children will be attending that one.
Awesome. Now I want a similar plot that is complexity of talk by speaker (if only I was in charge, or had the drive to do it myself).
I second el oso;s suggestion. I suspect that talks in the Sunday morning sessions might be less complex because if children have to watch just one session, that is most likely it (and the brethren know it).
I too would be really interested to see if the complexity varies by which general session a talk is given in. I’d also hypothesize that the Sunday morning talks would be less complex, but I don’t know if that actually holds true. And I’m also interested in who gave the really high grade level talk(s) (not because I think it tells us anything particularly significant, but just because I’m curious). Thanks for the analysis!
I’m definitely planning to do another post with a breakdown by speaker. Given y’all’s suggestion, I’ll break the general sessions down by session as well.