For over a decade, the Church has published membership counts by country (and by US state, and Canadian province, and counts of units, and other various and sundry items) on its website. Over at the Mormon subreddit, a generous person who goes by the charming name latter_data_saint has scraped all the past data from the Internet Archive and made it available for perusal by any interested parties. And you can bet I’m an interested party, so I’ve taken a look.
In this post, I just wanted to look at US states, at which ones have membership growing more or less quickly, or even shrinking. From latter_data_saint’s data, I pulled out three data points for each state (and Washington, DC): the oldest value, the last value before the pandemic (which turned out to be late 2019), and the most recent value. Then I used these to calculate for each state the annual growth rate pre-pandemic (2012-2019) and post-pandemic (2019-2025). Of course you’ll want to keep in mind the usual caveats about how stated Church membership is going to be far higher than actual counts of posteriors in pews.
Warning: You might want to skip this paragraph if too much math makes your eyes glaze over. I got the annual growth rate from the total growth rate by just taking the yth root of one plus the total growth rate, where y is the number of years apart between first and last value, and subtracting one. For example, if the total growth rate were 10% for a particular state, and the values were seven years apart, then I would take the 7th root of 1+10% (or in other words, raise 1+10% to the power of 1/7), which works out to 1.014, so subtracting one gives a 1.4% annual growth rate. This means 1.4% annual growth over seven years gives 10% total growth: (1+1.4%)^7 = 1.10.
Here’s pre-pandemic growth.

California was alone in actually having a negative growth rate over the period. Texas and North Dakota had the fastest growth, and there was also some relatively strong growth in the old Confederacy, other than Mississippi. (Note that I excluded two states and DC for having a small number of members.)
Here’s the same map for post-pandemic years.
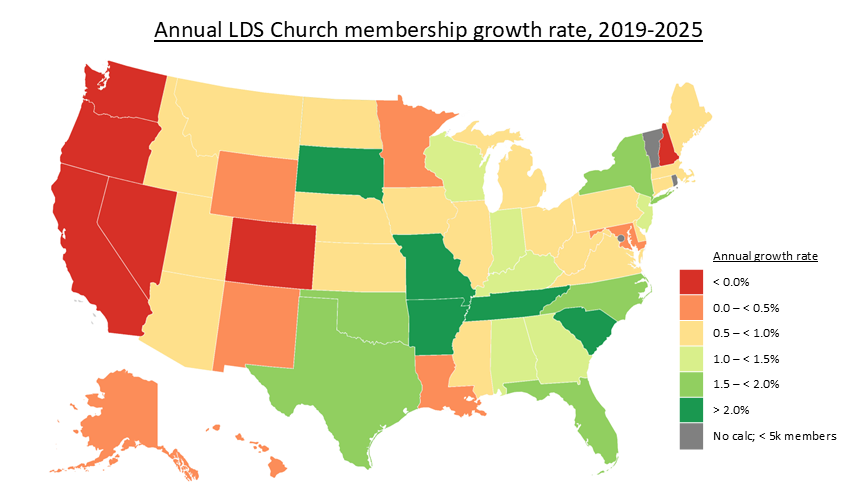
A bunch of states slipped back, with six, all but one in the west, now in decline. The old Confederacy still looked the strongest, and the Dakota growing fastest flipped from North to South.
For some context, here’s one more version of the map, showing total membership in each state as of the latest data point.
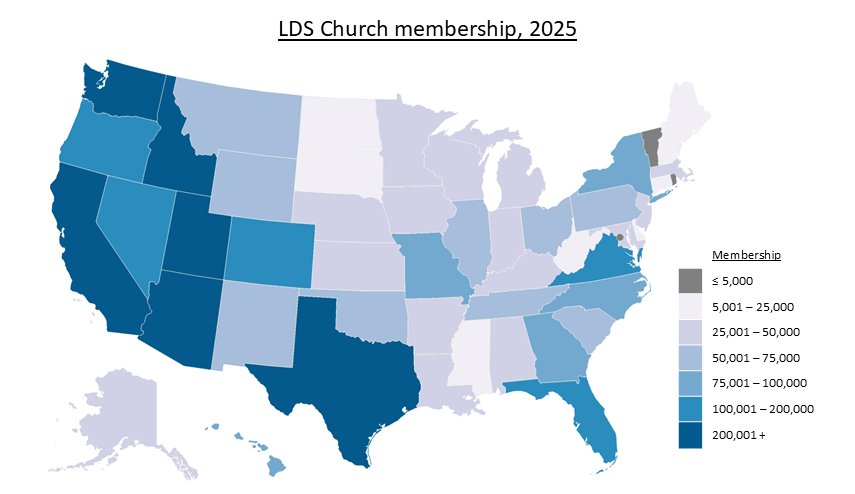 By and large, the states where the Church has started shrinking are those where it has large membership to begin with.
Finally, this table shows the actual membership and growth rate values. Putting data into buckets like I have for the maps inevitably overstates some differences and understates others when values fall near versus far from the bucket boundaries. This will let you check particulars if you’re curious. Or if you’re interested, the dataset is really not large or complicated, and you could download it yourself and check it out.
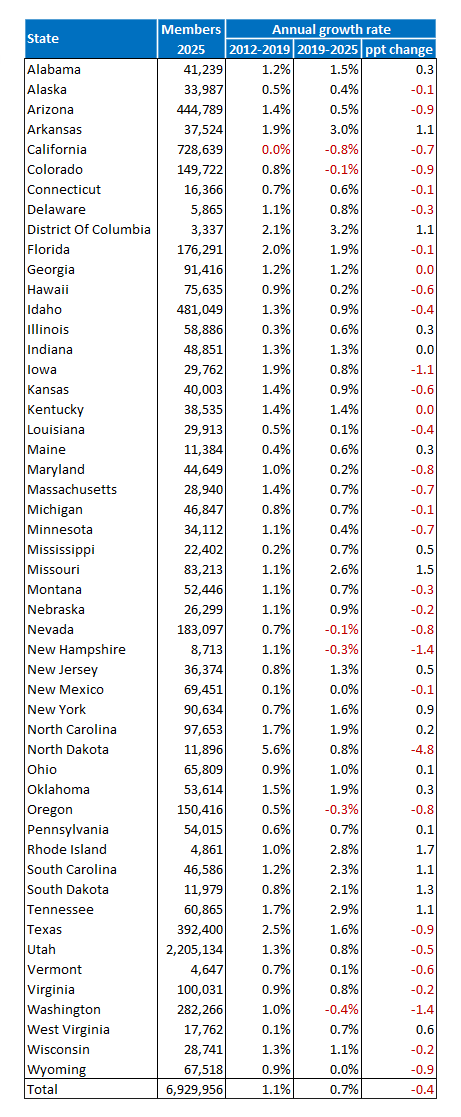
In case it isn’t clear, the last column is the percentage point difference between the 2019-2025 growth rate and the 2012-2019 growth rate. Also, if you’re checking carefully, the total is slightly different from the sum for all the states. It’s just the last-reported total, and some of the states have a last-reported value from a slightly different point in time.
I plan to make similar maps for other regions of the world if I get the time. Thanks again to latter_data_saint for providing this fascinating data!
Very nice! It’s so fun seeing people use this data. The growth in the midwest/southern states along with the western decline is interesting to see. I wonder how much of it is people moving and how much of it is unreplenished resignations/deaths.
Thanks, LatterDataSaint! And I agree. The changes are interesting, and I wonder with California in particular, whether it’s people moving (and moving in to Texas on the increase side), which I’ve heard of happening anecdotally just because of the cost of living.
I think people moving is part of why Utah’s Mormon population is not shrinking. I live in Washington county Utah, for those who don’t know counties in Utah, St George area. We are actually building chapels because there is so much growth of mostly retired folks moving in. The existing chapels (like my local one) have up to six wards crammed in, and we just got a new stake center, with no reduction of wards per building. And many of those move ins say their reason is they want to escape the liberal political climate of California. They voice this as an acceptable statement to make in public, not realizing that some of us want to send them right back. We don’t need more right wing nut cases, thank you very much. Twenty years ago, the most common reason was to enjoy the beautiful country and/or escape snow. Many of those moving in are Mormon, shown by our bulging buildings. I have even heard Arizona , Oregon, and Colorado escapees state that desire for a more conservative political climate. I also know from those Mormons moving into Southern Utah that many are moving out of California to Texas. The stated reason is always political.
One more map that would be helpful: what % of the state population is LDS?
If you think that everyone who moves out of California and cites politics as a reason is a right wing nut case, you have got to be really naive or really far left. California used to have very large areas with low crime that have now become much more dangerous. Their taxes and regulations have increased dramatically in recent years as well.
Upper middle class political moderates could be many of those moving for political reasons because of how much worse things have gotten for them. If you live close to a neighborhood that was completely burnt down in January, your house is probably worth a lot, but your insurance payments are really high and going up even more. You also can see how little progress in rebuilding is happening. Time to cash out and go somewhere else.
I was going to make a similar point to JonD: I’d be interested in church growth rates normalized by overall population growth rates. I say that because the big surge in growth in North Dakota in the first map coincides with an overall population boom related to the oil business there, so it’s not surprising that some of those moving in from out of state includes members of the LDS church. The other thing I wonder about is whether age demographics have any correlation with church growth rates.
El oso, I am just saying what the people moving into my area said. It is straight from the moving people themselves. They wanted a more conservative place to live. So, they picked Southern Utah. If you have a problem with it, don’t argue with me, but come listen to them yourself. I am a member of a club and new members get introduced every month. Yes, a small number of them are coming from north of here, Utah, Idaho, Montana, and Wyoming. They say they want the nice weather. But the probably the majority are coming in from California and they say that they moved because of the political climate of California. Now, they just might blame things like higher crime rates on the political climate. All I know is what they say.
Controlling for population change really seems to be a big factor here, as others have mentioned. I had ChatGPT get state by state populations for me in from both 2012 (beginning of data set) and 2025. They are estimates that I haven’t thoroughly vetted. But there are some interesting trends.
Compared to population size, a number of states are seeing decreasing LDS populations. Arizona (-0.2% annually), California (-0.7%), Colorado (-0.7%), Delaware (-0.1%), Idaho (-0.6%), Montana (-0.1%), Nevada (-1.0%), Oregon (-0.6%), Utah (-0.7%), Washington (-0.8%). With the exception of Delaware, these are all in the western US, and all places with higher LDS populations.
After adjusting for population growth, the church is growing the most in Arkansas (+2.0% annually), DC (+1.7%), Kentucky (+1.0%), Missouri (+1.4%), North Dakota (+2.2%), Oklahoma (+1.1%), Rhode Island (+1.4%), and Tennessee (+1.3%). All other states came in less than 1.0%. Sunbelt states with high population growth over the time period had the largest corrections (FL, GA, NC, SC, TX) along with other fast growing states (AZ, CT, CO, ID, MT, NV, ND, UT, WA).
States with very low growth rates are comparatively seeing more relative growth than Ziff’s charts (AK, IL, LA, MS, NM, NY, PA, WV, WY) and those states are all yellow and orange on the maps.
LDS membership growth is, of course, driven by many factors, primarily relocation of members from other places, convert baptisms and baptisms of record. And of course the ever present unknown of whether activity rates are at all similar across the country.
Thanks, JonD and Quentin, for raising the question of Mormons as a fraction of total population, and DaveW for answering it. Really I was just planning to start with the super basics, the counts growing and shrinking, but you all have great points about getting into causes. I really am planning to do more posts on other parts of the world when I get time, because I suspect Africa and Europe will look especially interesting, going in opposite directions!
The data appears to support the basic people leaving blue states for Red states trend of the last 2 decades. No real suprise.
California’s population is growing. Anecdote: two of my friends moved from California to Texas during the. pandemic. Have since moved back. Hated the weather. hated the politics. Hated the over-the-top performative religiosity. But mostly the weather…