Michael Austin has a great post up at BCC about how small a percentage of the faculty at the BYUs are women, and what a bad message this sends to students, both female and male. I thought it might be interesting to look at the IPEDS data he used in graphical form.
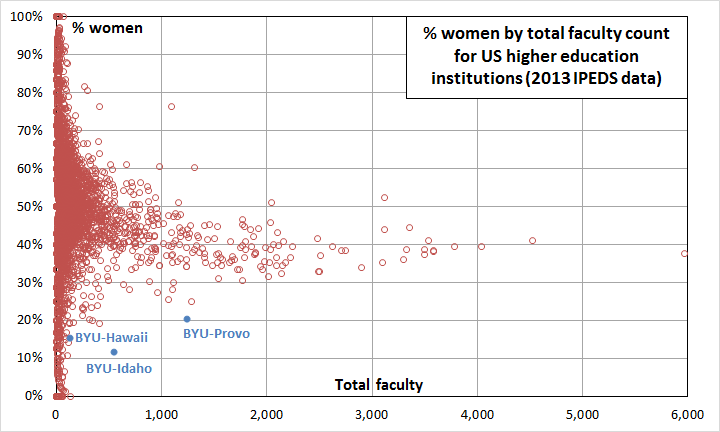
Here’s a scatterplot showing each institution’s percentage of faculty who are women as a function of total faculty size.
It looks like the smaller institutions are much more variable, but as they get larger, they cluster much more tightly around a percentage of about 40. I’ve highlighted the BYUs in the bottom left. BYU-Provo is particularly an outlier considering its size. It has 1236 total faculty and 20% women. To find another institution with a lower percentage, you have to go all the way down to the New Jersey Institute of Technology, with 19% and 413 total faculty. BYU-Idaho is even more dramatically different from similar-sized institutions. It has 541 total faculty and 12% women. To find another institution with a lower percentage, you have to go all the way down to Musicians Institute, with 104 total faculty and 11% women. BYU-Hawaii, with 130 faculty and 15% women, isn’t the most extreme among similarly-sized institutions like the other BYUs are, but it’s clearly at the low end.
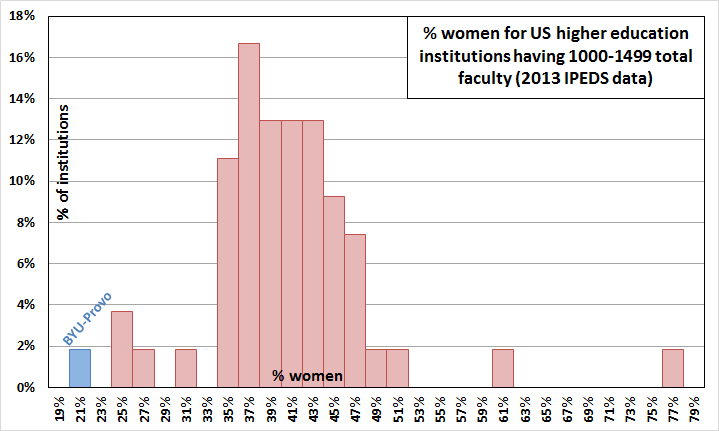
To look at this comparison a little more closely, I made a histogram for each BYU to compare it to institutions with similar total faculty counts. Here’s BYU-Provo compared to institutions with 1000-1499 total faculty.
 Note that the percentages along the bottom are the middles of the bins, so BYU-Provo falls into the 20 to less than 22% bin (labeled “21%” because it is the midpoint). These are relatively large institutions, so like you can see with the scatterplot, most fall near 40%. BYU-Provo has the lowest percentage.
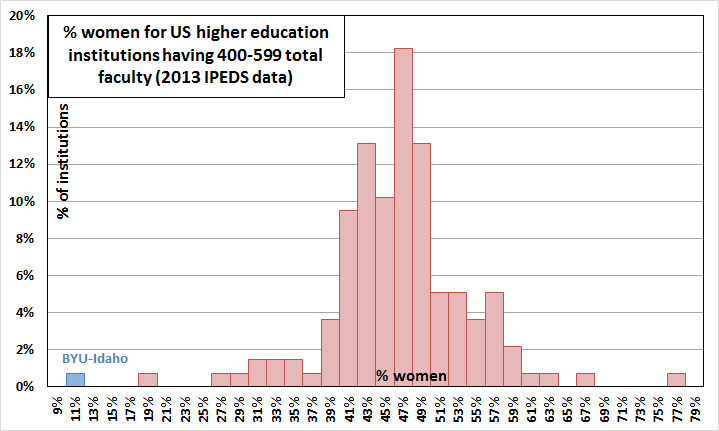
Here’s BYU-Idaho compared to institutions with 400-599 faculty. Note that because there are more institutions, I chose a narrower range to compare it to.
 Again, it’s clear that BYU-Idaho is even more of an outlier than BYU-Provo is.
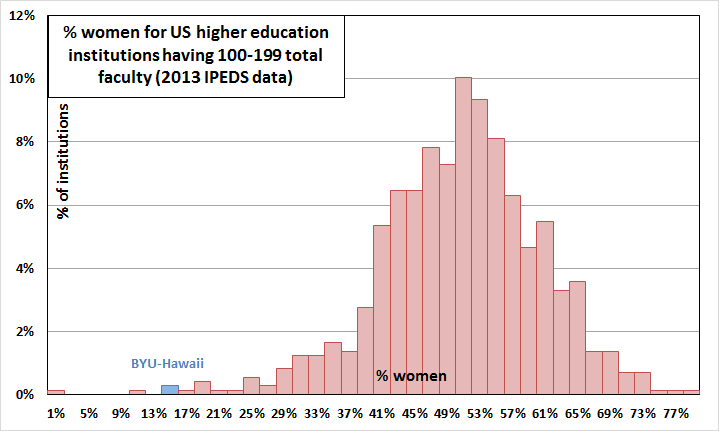
Finally, here’s BYU-Hawaii compared to institutions with 100-199 faculty.
 BYU-Hawaii is only one of two institutions represented by the 15% bar, but I couldn’t figure out a way to color just half the bar.
I don’t have anything to add that hasn’t already been said better in Michael’s original post, or in Kristine A.’s excellent related post at Wheat and Tares, or in some great comments on both posts. Like I said, I just thought these graphs might be interesting to look at.

This is great; thanks, Ziff! I’d love to see the graphs of non-permanent faculty and non-faculty staff, too, if you have extra time lying around.
I agree the original post and Kristine A’s companion piece are fabulous. But I really appreciate your add here. For those of us that like pictures, this perfectly paints how firmly the Church is stuck in the late 1950s.
Another thing for your Copious Free Time: It would be interesting to see how the percentage of female faculty at BYU has changed over time. But that might involve digging through old catalogs and trying to sex faculty members based on their first name.
I received two degrees from BYU and attended during the period of 1977-1986. During that time, the Zoology Department did not have any female faculty. I’m pretty sure that none of the female instructors I had at BYU had any professor rank. I did have a fair number, but I think they were all graduate students, Instructors, or adjuncts.
As low as it is, the sex ratio of professors has certainly improved since I was there.
What I find interesting in your first graph is how it is almost a bell shaped distribution, although it looks to be centered at about 40% female faculty instead of 50%. Even given that, there seem to be almost as many institutions skewed heavily female as there are skewed heavily male. As I asked in the BCC thread, is this a concern for anyone or is the demand for equality in male/female university faculty only a concern when males are in the majority?
This is excellent. Thanks, Ziff.
The visual presentation of the data reveals just how outside the norm the BYUs are. Stuck in the 1950s? Unfortunately true, but if the comments at BCC are accurate, joining the 21st century may take another century or so.
Im curious to know what percentage of BYU professors and faculty are married and started families young which placed the mother in the home while the father continued school, then became employed at BYU. I tend to think that the discrepency at BYU vs other schools has to deal with the family structure of the church and mothers stayingghome while father has good paying job at the university.
KLC my guess is that those outliers on the other side of the curve are women’s colleges, or some kind schools that offer field-specific training that mostly cater to women (fashion design?). If Ziff has time to tell us the identity of those outliers that would be interesting.
I predict the outliers on that side of the curve are not universities like BYU who mainly teach liberal arts to undergraduates. Which means they don’t have counterpart outliers on the other side of the curve, which makes them even more unusual.
Great stuff, Ziff. I thought the scatterplot was especially revealing.
Emily, your explanation may be correct, but you didn’t answer my question. From Ziff’s data there are, surprising to me, about an equal number of institutions of higher education that are skewed as heavily toward females as there are skewed heavily towards males. Is this a concern? Are their alumni ashamed and horrified about that imbalance? Are there cries for immediate action to change them? I’m going to go out on a limb here and guess no. I think it’s an important question because it illustrates whether the demands for changes to heavily male institutions are really about equality, which is always the battle cry. People genuinely concerned about inequality would be striving to eliminate it everywhere, not ignoring it when it doesn’t fit their needs.
KLC, I think it’s easy to imagine that these inequalities exist in some sort of vacuum, and so inequality in one direction is just as much of an issue as inequality in another. But they exist in a historical setting where women have been second class to one degree or another for a very long time, and in a larger context where they’re still judged far more harshly than men are for their employment and parenting choices. So no, I don’t think the differences in the other direction are much of a concern.
Ziff, I’m with you that we need to put things in historical perspective when deciding how much outrage to muster. That said, i do think those highly female leaning institutions would be better served if they diversified.
Ziff, so some animals are more equal than others? Thanks for the honesty but I find it really disturbing. Do you really want to go down a road that makes it OK to compromise principles if it’s for your side?
KLC, well, thanks. I’m equally disturbed that your approach of distraction seems to be designed to stymie attempts to have women achieve real equality. So long as men aren’t equal in any one place, you can plausibly argue that any pushes to achieve more equal treatment of women are misguided because we really need to focus just as much on the men.
Where did I say any of that? I was curious about your own numbers, which like I said, surprised me. I think anyone following this issue at BCC or here would just assume that a tally that comprehensive would show a distribution completely skewed to the bottom of your graph and yet the top and bottom halves of your graph are almost mirror images. What is distracting about analyzing and understanding data? I’m interested in numbers just like you are and when I saw that I was intrigued whether the same principles govern the top half as they do the bottom half. You certainly have proved yourself to be willing to ask hard questions about data in past posts, are hard questions only acceptable if you ask them?
You didn’t say it; you’re acting it out. If you protest at a large problem of discrimination against women by saying, “but men are discriminated against sometimes too,” you’re trying to prevent the larger problem from being addressed.
How is a question about data a protest? How is a question about data saying “men are discriminated against sometimes too?” And how is a question about data on an obscure blog the equivalent of “trying to prevent the larger problem from being addressed?” Be honest, I didn’t say or do any of those things, you are inserting them into your own concocted narrative where you are the principled crusader for women and I am the troglodyte barbarian at the gates. Neither one of us are those and it’s unfortunate that you can’t discuss this without creating fantasy foes you can easily dismiss. I’m not your enemy, I’m an enthusiastic reader of the many thoughtful posts at ZD and other LDS blogs, some of which have first angered me but then made me stop and honestly examine my assumptions and motives. And the result of that introspection has changed me for the better in fundamental ways. Something about my question has triggered that same kind of visceral response in you, which I admit was exactly what I intended. But are you honest enough to even entertain the notion that the reason for that response might lie in you and not in what I asked?
You may be right, KLC. I guess when I see the type of question asked that you asked, it does seem to me that it’s a diversion tactic to prevent what I see as the larger problem from being addressed. Sorry to jump to conclusions.
Ziff I appreciate your enthusiasm for numbers and your desire to improve lives, plus the time you put into making ZD a great place to visit. I’m sorry our exchange veered off into the weeds of internet discussion. All the best, sincerely.
Thanks, KLC. You too!
The data is sadly lacking in fine consideration of more nuanced “gender identity” and instead relies exclusively on the outdated gross categorization of so-called “male” and “female”.