Church President Probability Changes with Elder Scott’s Death

Elder Richard G. Scott died yesterday at the age of 86. As I did when Elder Perry and President Packer died, in this post, I’ll show how this changes the probabilities of becoming Church President for the remainder of the members of the Q15.

All the probabilities come from a simulation I did for a post back in April. It’s a straightforward simulation: it uses an actuarial table and each Q15 member’s age and seniority in the quorum as inputs, and it draws a series of random numbers to simulate different possible life expectancies for each member. The life expectancies are then compared to find in what fraction of the simulations each member outlives all other members senior to him to become President. For a more detailed description, see my April post.

Here are the changes with Elder Scott’s death:

change in probabilities of becoming president with elder scott's death Read More

Church President Probability Changes with President Packer’s Death

President Boyd K. Packer died on Friday at the age of 90. As I did when Elder Perry died, I thought it would be interesting to look at how this changes the probabilities of becoming Church President for the other members of the Q15

Here are their probabilities and average predicted years of being President before and after President Packer’s death. These come from the simulation I posted about a few months ago where I used a mortality table to run 1000 scenarios and see in how many each Q15 member would become Church President.

change in probabilities of becoming president with president packer's death Read More

Church President Probability Changes with Elder Perry’s Death

Elder L. Tom Perry died on May 30th at the age of 92. I’m sure you won’t be surprised to learn that one question that I immediately wondered about on hearing the news was how this would affect the other Q15 members’ probabilities of becoming Church President.

Here are their probabilities and average predicted years of being President before and after Elder Perry’s death. These come from the simulation I posted about a couple of months ago where I used a mortality table to run 1000 scenarios and see in how many each Q15 member would become Church President.

change in probabilities of becoming president with elder perry's death Read More

Quote . . . Close Quote

I make the Sunday bulletins for my ward. I typically put a quote from a scripture or a Church leader that’s related to the theme of the sacrament meeting on the front. I often look for quotes from Church leaders by looking through recent Conference talks on related topics. Recently while I was doing this, I was reading a talk given by a member of a general auxiliary presidency, and I was struck by how much of her talk was made up of quotes of other sources. This reminded me of David Evans’s excellent post at T&S a few months ago where he looked at which speakers in Conference quote which types of sources. One of his findings was that higher-authority speakers quoted less from high authority sources than did lower-authority speakers.

What I wondered is whether higher-authority speakers quote other sources in general less than lower-authority speakers, regardless of the level of authority of the sources being quoted. An advantage of this question is that it didn’t require me to figure out authority levels of sources. Instead, I could just count words in talks and count how many of the words were in quotes.

I got data from all the talks in the last ten Conferences (October 2010 – April 2015). For each talk, I noted the speaker’s calling, the number of words in the talk, and the number of words in the talk that were part of a quote. Here are results by calling group.

Position Talks Percent quotes
 First Presidency  88  14.8%
 Quorum of the Twelve  118  21.8%
 Quorums of Seventy  99  21.5%
 Other – men  19  20.8%
 Other – women  50  24.1%

Read More

Alzheimer’s Prevalence in the First Presidency and the Quorum of the Twelve

How many of the fifteen men in the First Presidency and the Quorum of the Twelve are currently suffering from Alzheimer’s disease? Of course I don’t know the answer to this question. I can give you an estimate, though. Since I’ve been crunching numbers recently to predict which Q15 members might become Church President, I have all these data on their ages and life expectancies lying around, and given that age is a strong predictor of Alzheimer’s, I thought it would be an interesting exercise to match up the age data with an Alzheimer’s prevalence table to see what proportion of the quorum might suffer from it in the past, present, and future.

The major data sources I used are (1) ldsfacts.net for birth, calling, and death dates for historical Q15 member ages, (2) the simulations I did for my post last month on predicting who will become Church President, for future Q15 member ages, and (3) this paper from the journal Alzheimer’s and Dementia for the Alzheimer’s and dementia prevalence rates. If you’re interested, I’ve described the process I followed in more detail at the end of this post.

Here’s a graph showing the average age of the Q15 and the age of the Church President from 1835 to 2014 (taken at the end of each year), and predicted ages for the Q15 and for the Church President for the next 15 years. I calculated predicted ages in two ways, one using the SOA mortality table that I used for my post last month about predicting which Q15 members would become Church President (labeled “not adjusted” in the graph, with darker colored lines), and the other (labeled “adjusted,” with lighter colored lines) with the mortality rates in the SOA table multiplied by 0.89 because I found in analyses for another post that this provided better fit to actual historical mortality rates of Q15 members.

president and q15 age Read More

A Look at Conference Speakers’ Favorite Verses of Scripture

I thought it might be fun to look at which speakers in General Conference are most fond of quoting which particular verses of scripture. If you’re thinking you’ve seen me blog about this before, you’re right. It’s just that in my previous posts, I’ve only looked at the level of book of scripture, but now I’m getting all the way down to the verse level. I apologize in advance; I don’t have any interesting hypotheses to examine here. This is another post where I’m just looking at some data descriptively and saying, “Isn’t this cool?”

I took scripture reference data from the LDS Scripture Citation Index. I used the current version of their site and not the new beta version because it was easier for me to pull data from the current version. Unfortunately, this means that what I have is only updated through 2013. The Conference data begins in 1942.

The table below lists the top five verses cited for speakers in Conference since 1942. I’ve limited it to showing top fives for two groups of people: Q15 members who have at least 500 total verses cited, and female auxiliary leaders who have at least 100 total verses cited. Many of the speakers have a tie in their #5 spot, so I’ve extended the table to show all tied verses, except in a few cases where it would have made the table ridiculously long (e.g., Julie B. Beck has a 25-way tie at #5). I’ve also included a brief quote or summary note on each verse to help jog your memory for verses that are less well-known, and I’ve linked each verse reference to the scriptures at lds.org so you can go read them in full if you’re interested.

Read More

Predicting Who Will Be Church President: Fit of Actuarial Mortality Table to Historical Data

Last month, I wrote a post where I used a mortality table and the current ages of the First Presidency and Quorum of the Twelve to see who among them would be most likely to become Church President. One question that was raised on the post and in some Facebook discussions was how well that mortality table matched up to historical mortality rates of Q15 members. In this post, I’ll try to answer that question.

I looked at historical data from January 1960 to April 2014. Each month1, for each current Q15 member, I noted two pieces of information: his age at the beginning of the month, and whether he was still living one year later. When I aggregated all the data together, they made an empirical mortality table. For any age that at least one Q15 member during that time period lived to, the proportion of such members who died within one year was the empirical mortality rate. Of course, there’s more data for the table at some ages than others, as few Q15 members during this time period were as young as their forties, but many have been in their sixties, seventies, and eighties.

Here’s a graph showing the mortality rate for Q15 members (in red), along with the mortality rate for the Society of Actuaries mortality table I used (in blue). I included only ages for which I had at least 120 person-month observations (or 10 person-years).

one year mortality rate by age for q15 members 1960-2015 Read More

Could President Uchtdorf Become *President* Uchtdorf?

https://www.lds.org/bc/content/ldsorg/church/news/580-newUchtdorf%20CES.jpg

After I wrote last week about the probability of each of the members of the Q15 becoming President of theChurch, a few people asked specifically about President Uchtdorf’s chances. And I share their interest. I have found him to be a big breath of fresh air, and I would love it if he did become President.

So what would it take for President Uchtdorf to become President Uchtdorf? Here’s a chart showing a little information for him and all the Q15 members senior to him.

Quorum member Rank Birth year/mo Age Prob Uchtdorf outlives
 Monson  1  1927 Aug  87  84%
 Packer  2  1924 Sep  90  88%
 Perry  3  1922 Aug  92  91%
 Nelson  4  1924 Sep  90  86%
 Oaks  5  1932 Aug  82  71%
 Ballard  6  1928 Oct  86  80%
 Scott  7  1928 Nov  86  82%
 Hales  8  1932 Aug  82  74%
 Holland  9  1940 Dec  74  48%
 Eyring  10  1933 May  81  69%
 Uchtdorf  11  1940 Nov  74  N/A

Read More

Verses of Scriptures Most Often Quoted in Conference

Which of the Ten Commandments gets quoted most often in General Conference? In this post, I’m going to look at some lists in the scriptures (like the Ten Commandments, the Articles of Faith, etc.) and show the relative popularity of the items in the list in terms of how often they’ve been quoted in Conference.

As I so often do, I got data from the LDS Scripture Citation Index to answer this question. They have data from Conferences from 1942 to 2013. Unlike with my other recent posts using their data, I took data not just at the level of book of scripture, but all the way down at the verse level, which of course was required to allow me to look at comparisons between individual verses.

So let’s get started. Which of the Ten Commandments is cited most? (For simplicity, I just looked at references to Exodus 20, and not to any other places in the scriptures that the Ten Commandments appear.)ten commandments Read More

Predicting Who Will Be Church President (Now Continuously Updated!)

Update: Now that Elder Perry has died, I have replaced the continuously updated table and graph with static versions that show the probabilities as of May 2015. I will write a new post with continuously updated probabilities after his replacement is called in October.

Who among the current First Presidency and Quorum of the Twelve is mostly likely to eventually become President of the Church?

Read More

Which GAs Prefer Which Books of Scripture? (Take 3)

This post is a follow-up to my post last week, where I looked at how much members of the First Presidency and Quorum of the Twelve (Q15) quote from each of the five books of scripture in the LDS canon in their Conference talks. In the previous post, I showed one breakdown for each Q15 member, aggregating his citations of scripture in all his Conference talks, across whatever period of years he served in the Q15. In this post, I’ll show trends across time for each individual Q15 member. The previous analysis would miss it if a GA changed over time from preferring the Book of Mormon to preferring the New Testament, for example. This analysis might be able to show such changes (if they’re large enough). As for the previous post, my data source is the LDS Scripture Citation Index.

The graphs below show seven-year moving averages for the percentages of citations each Q15 member took from each book of scripture. There’s nothing special about seven years for the moving average. I chose it by eyeball. The year-to-year data often jump around a lot, which isn’t surprising given that for Q15 members who aren’t in the First Presidency, one year’s worth of Conference talks is typically just two talks. Seven years of aggregation looked like a good compromise that smoothed out the yearly variation but didn’t smooth so much that it made changes over time disappear. One other note is that I’ve only made graphs for members who have at least 16 years of data. This allows for 10 years worth of seven-year moving averages to be shown (because the first six years are combined into the initial seven-year moving average).

Graphs for Q15 members are shown in the order they were called, which is the same ordering I used in my previous post. Also, to make it easier to look back and forth between the two posts, I’ve used the same color to represent data for each book of scripture as in the previous post. One warning with these graphs is that the scaling of both the horizontal and vertical axes changes from person to person to best display each Q15 member’s data, so be careful if you’re looking at comparisons across graphs.

books of scripture quoted across time - kimball Read More

Which GAs Prefer Which Books of Scripture? (Updated!)

I wrote a post last year that looked at which books of scripture members of the First Presidency and Quorum of the Twelve (Q15) quote from most in Conference. In an article published last week, Peggy Fletcher Stack briefly referred to my work in a discussion of the Book of Mormon taking priority over the Bible in Mormon thought. She specifically talked about the influence of Ezra Taft Benson, and it occurred to me that it would be easy to expand my post from just looking at the living members of the Q15 to including past members as well, so we could actually see what President Benson’s numbers looked like. In this post, I’ll look at which books of scripture members of the Q15 back through Spencer W. Kimball quoted most in Conference. Unfortunately, I can’t go farther back than that because the LDS Scripture Citation Index, from which I’m pulling data, only goes back as far as 1942, so Q15 members called before then have incomplete data. President Kimball was called to the Q15 in 1943, so he is the oldest member for whom I have complete data. Read More

Aging of the First Presidency and Quorum of the Twelve

The median age of the members of the First Presidency and Quorum of the Twelve (Q15) is currently about 83. Even for a group that’s often thought of as being old, this is unusual. In fact, the Q15 is older now than it has ever been before.

Here’s a graph showing the age of the Q15 since 1835. The blue line shows the median age. The orange lines show the age of the oldest Q15 member; the green lines show the age of the youngest. The dashed black line shows the age of the Church President. The data come from ldsfacts.net.

GA age 1835-2014 Read More

A So-called "Post"

In Angela C.’s hilarious post “Mormon Jargon 2” at BCC, this is her entry for “so-called”:

So-called (adj.) I sneer at whatever word follows this adjective

It seems like this is a term GAs use fairly often to indicate disapproval, as Angela observes. Elder Oaks, for example, last October, used it at least a couple of times (maybe even three?) in his talk “No Other Gods” (although only one occurrence made it into the written version). I thought it might be interesting to look back at who uses “so-called” most often, what they’re disapproving of, and whether there is any trend over time in its usage.

Read More

Which GAs Do Readers of Different Blogs Like?

I thought this might be a fun question to look at, and thanks to Facebook’s Graph Search, I have at least an approximate way to answer it. Graph Search will let you look for people who “like” different combinations of pages. (For the remainder of this post, I’m going to drop the quotation marks on “like” when describing Facebook likes, because they just get tiring to look at, and I figure you know what I’m talking about.) Most blogs that I wanted to look at have a Facebook page that readers can like, so I just looked up people who liked the Facebook page for each blog, and then looked at how many of each of these people liked each member of the Quorum of 15. One small difficulty I encountered is that Graph Search is more interested in showing me individual people than in giving me an exact count (which makes sense given what Facebook is for). It estimates the number of people who like a blog page and a GA page as more than 10, or fewer than 1000, or whatever, but I couldn’t get an exact count without repeatedly scrolling to the bottom of the results so that it would pull up even more results until it could find no more.

One thing I wanted to adjust for is that the general membership of the Church likes different Q15 members more or less often on Facebook (as I’ve blogged about before and plan to again). So I thought it would be most interesting to see which Q15 members are most liked by readers of different blogs, compared to how often the GAs are liked overall. For example, President Monson alone accounts for nearly 20% of all likes of Q15 members. If he gets only 15% of likes given to Q15 members by readers of a particular blog, this indicates he’s less popular among readers of the blog than among members in general (even if he still gets more likes than any other Q15 member from readers of the blog).

Here are results for ZD. The differences are in percentage points (the percentage of all likes of Q15 members going to this member among likers of the blog minus the same calculation for all Facebook users). I put the First Presidency at the left because a lot of the action is there, and then put the Q12 in order of seniority. Note that I’ve added the colors just to make it easier to see who is who at a glance. A lot of these graphs look similar, so I think it can be helpful to have the colors so you can easily look for the same person as you look across graphs.

zelophehad's daughtersWell, that’s a pretty straightforward pattern. ZD readers like President Uchtdorf. They really, really like him. Most everyone else falls below overall norms to compensate.

Read More

Which GAs Prefer Which Books of Scripture?

Thanks to the handy LDS Scripture Citation Index (LDSSCI), it’s easy to get data to answer this question. I looked up each of the current members of the Quorum of 15 to see how often he cited the Old Testament, New Testament, Book of Mormon, Doctrine and Covenants, and Pearl of Great Price in his Conference talks. For example, for President Monson, the counts are 332, 818, 184, 255, and 32, respectively. Here are counts for all Quorum members:

Counts
Member OT NT BoM D&C PGP Total
Monson 332 818 184 255 32 1621
Packer 125 312 559 470 96 1562
Perry 95 116 141 106 74 532
Nelson 399 695 910 945 209 3158
Oaks 149 538 504 386 60 1637
Ballard 26 139 133 111 32 441
Scott 25 57 203 144 34 463
Hales 77 336 291 187 78 969
Holland 70 243 140 74 24 551
Eyring 27 97 162 135 16 437
Uchtdorf 56 166 126 121 28 497
Bednar 19 60 148 87 15 329
Cook 27 57 73 82 9 248
Christofferson 11 129 139 118 26 423
Andersen 17 98 102 59 11 287

Next, to adjust for the fact that Quorum members differ in the total number of scripture citations they put in their talks, I converted the counts of citations to percentages of all citations by the member. Using President Monson as an example again, this means dividing each of his counts by book (332, 818, 184, 255, and 32) by his total (1621) to get his percentages. Here are percentages for all Quorum members:

Percentages
Member OT NT BoM D&C PGP
Monson 20% 50% 11% 16% 2%
Packer 8% 20% 36% 30% 6%
Perry 18% 22% 27% 20% 14%
Nelson 13% 22% 29% 30% 7%
Oaks 9% 33% 31% 24% 4%
Ballard 6% 32% 30% 25% 7%
Scott 5% 12% 44% 31% 7%
Hales 8% 35% 30% 19% 8%
Holland 13% 44% 25% 13% 4%
Eyring 6% 22% 37% 31% 4%
Uchtdorf 11% 33% 25% 24% 6%
Bednar 6% 18% 45% 26% 5%
Cook 11% 23% 29% 33% 4%
Christofferson 3% 30% 33% 28% 6%
Andersen 6% 34% 36% 21% 4%

(Note that the percentages do not add to 100 for some members because of rounding.)

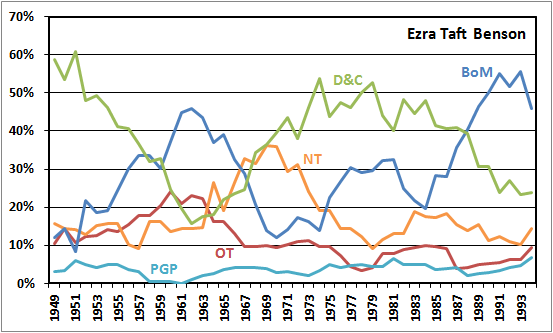
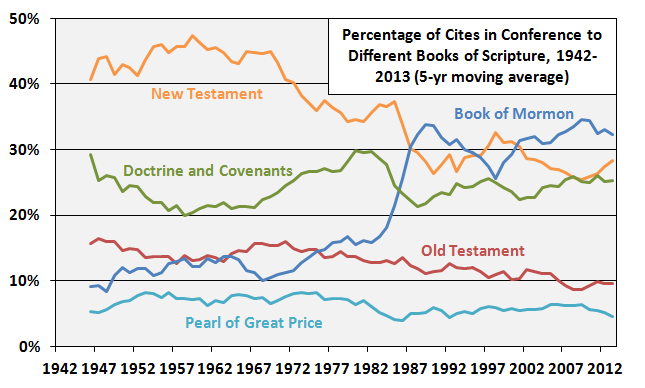
Finally, I did one more adjustment to account for the norms of how often the different books of scripture are cited in Conference by all speakers during the years each Quorum member served. What I mean here is that at different points in time, different books of scripture were cited more or less by all speakers in Conference. Because members have been in the Quorum for different amounts of time, some of the differences between them can be accounted for by the different norms in Conference at the times they were giving talks.

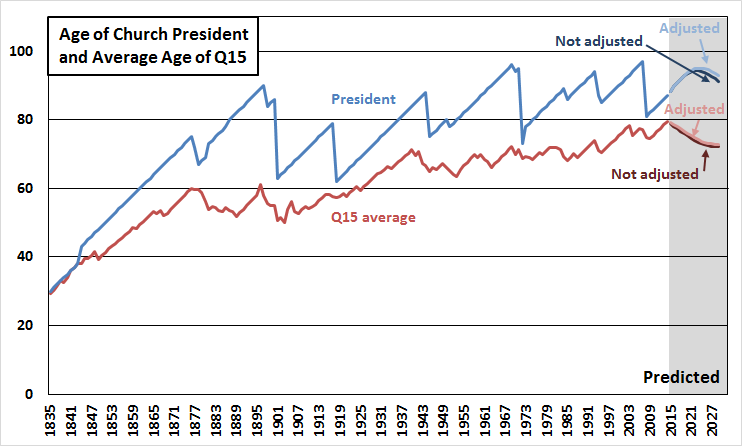
The biggest shift in the time current Quorum members have served has been an increase in citations of the Book of Mormon. Here’s a graph showing the percentage of all citations of scriptures in Conference that came from each of the five books of scripture since 1942 (as far back as the LDSSCI has Conference talk data).

conference books of scripture quoted Read More

General RS Presidencies Having Children and GAs Having Children

On my post last week about how many kids GAs have, Petra asked about what the numbers would look like for women in general Church leadership positions. To answer this question, I’ve looked up the number of children that women in the General Relief Society Presidency (hereafter, GRSP) have had. To match the dataset I have for the FP/Q12, I included only women called since 1920.

Read More

GAs Having Children and Talking about Having Children

In comments on Steve Evans’s recent post at BCC on how birth rates might be increased in accordance with GAs’ counsel to have more children, the question was briefly raised of how many children GAs themselves have. One commenter pointed to a post at By Study and Faith where Jared had found that younger members of the Quorum of the 12 have fewer children on average than do older members.

In this post, I will try to expand a little on Jared’s study by looking at FP/Q12 members over a longer period of time, as well as by trying to look at the link between GAs having lots of children and GAs encouraging Church members to have lots of children more explicit.

Read More