Last week I blogged about looking for differences in General Conference talk complexity by session type. I thought it would be fun to break down the same data in a couple of other ways.
A couple of commenters on the last post asked about whether there were differences among the general sessions. Here are boxplots for talk complexity by Flesch-Kincaid grade level for the four general sessions across 1971-2013. (I’m excluding priesthood sessions because, even though they’re called “general” sessions, they have a more specific audience, so I separated them out in the last post.) These boxplots have the same form as the ones I put in the last post. the difference is that I’ve turned them on their sides.
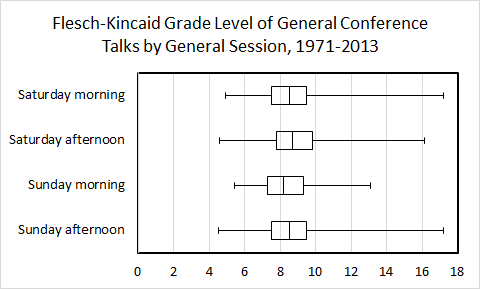
It does look like maybe the afternoon sessions on each day have slightly more complex talks than the corresponding morning sessions, but the effect is really small, and I’d guess it’s most likely just noise.
More interesting (to me, anyway) is this next breakdown, which shows Flesch-Kincaid grade level for the 123 speakers who have given at least five talks in Conference in the 1971-2013 time period. As with the above boxplots, they’re turned on their sides compared to the ones in my last post. I’ve ordered the speakers by their median F-K grade. I’ve also added color to some of the boxes to highlight different groups. Living members of the Quorum of 15 have light blue boxes. Past members of the Q of 15 have dark blue boxes. Women have red boxes. Everyone else (Seventies, Presiding Bishopric members) have white boxes.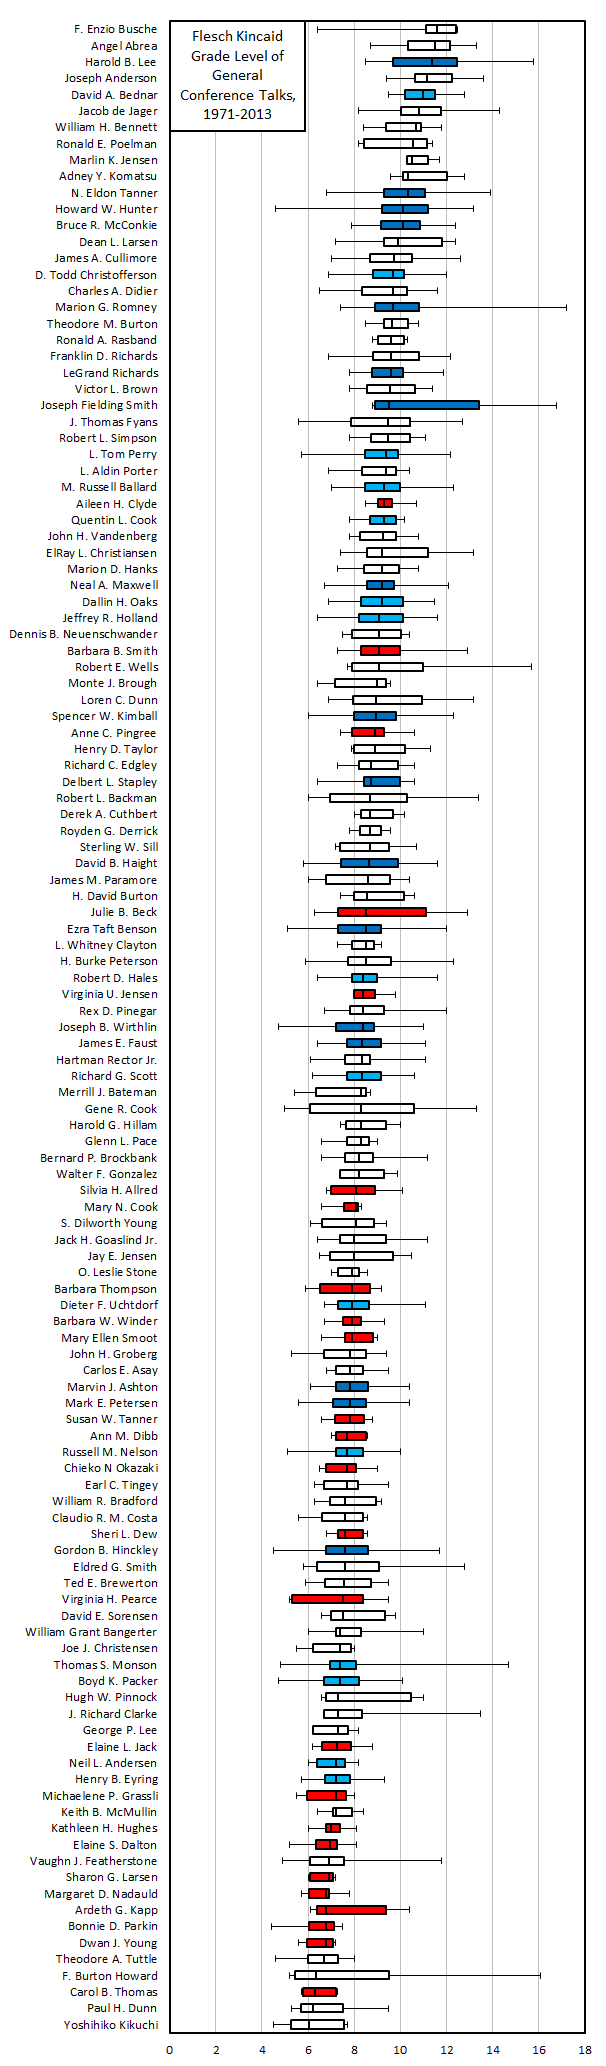 I’m not sure that I had any strong expectations going in about who might score high or low. I’d love to hear in the comments about any people who fall where you expected them to, or out of line with where you expected. One general trend is worth noting: The women score noticeably lower than the men. Aileen H. Clyde, the highest-scoring woman, ranks 30th out of the 123. Six of the bottom ten scorers are women. This is obvious, I’m sure, but I think this result highlights that women rise in Church hierarchy (as far as they can) probably for different reasons than men do. I suspect a women who spoke like Elder Bednar, for example, would be less likely to be called into general leadership.
I’m interested to hear of any other patterns you see in these results by speaker.
I have a few theories:
Could it be, perhaps, that the female speakers are better at delivering simple, understandable messages than, say, Bro. McConkie? Women have been historically much better trained at communication. But I notice that my favorite male speakers tend to speak more plainly, as well.
Or perhaps the education level of males vs females in the 60+ age group is rearing its head.
Also, women have only been “major” conference players in the more recent past. I think that talks in general, not just in the church, have gotten easier to understand from our perspective (dumbed down?) during that same period.
Whatever the answer, I’m sure it’s a mix of several things. Very interesting graphs. Thanks!
Very interesting. I love that you have provided an objective way to qualify a trend that many have noticed for a long time (differences between male and female speakers). Just curious, what specific aspects of Elder Bedner’s speaking style are you referring to at the end of the post?
Thanks for sharing your ideas, Bethany!
Beatrice, sorry I wasn’t clearer. I just meant that Elder Bednar scores as the most complex speaker among current apostles, and complex speaking might be seen as an asset for male leaders, but is probably less so for female leaders.
Most complex living speaker = man who talks about pickles…hmm…
The dark blues (deceased Q15) really tend to the more complex. In fact, it looks like Elder Bednar and Christofferson are outliers. Everyone around them is emeritus or deceased and the next light blue down the list is the oldest living apostle (Elder Perry).
It is not really a suprise that President Hinckley is the lowest on the scale among the deceased Q15, he intentionally spoke to a very wide audience (including those who needed translation).
President Monson is also fairly low due to the stories that he relates and the style he uses for them. No suprise there.
Do you have which talks rated at grade 17 by Pres. Romney and Smith?
Wow. Mark read this to me as we drove back from California earlier this week. I’m so impressed with the analysis.
Mark has lots of questions and ideas on how else to use the data, but then again, that’s Mark. 🙂
Great analysis! I’d love to see this in a temporal aspect. Maybe in 5-year increments, how the complexity has changed over time. Also, did you isolate the complexity of the Quorum of the 15 to talks while they were in that quorum, or does this include talks from before they were called into it. I’m curious if that changes things too.
Definitely some surprises here.
I’m surprised to see Neal A. Maxwell so low.
I’m not surprised to see Aileen Clyde so high — she strikes me as someone who is unafraid to be known as smart and driven. In other words, why would she hide her talents in a General Conference talk? She’s the bomb.
El oso, sorry to be slow. I’ll link to those highest-scoring talks this evening when I can get back to my data.
SeanK, thanks! I’ll do something with the change over time (and I think el oso asked about this too) in another post. I just glanced briefly at the means across time, and they didn’t look like there was much movement, but I’ll have to see what I get with a more detailed analysis.
Jessawhy, I’m glad you all enjoyed it! I’ll have to bug Mark and see what breakdowns he’s interested in. I have to admit, I was really excited to get this dataset put together, so I’m hoping to poke it in lots of different ways to maximize my entertainment. 🙂
Okay, el oso, here are the top scoring talks from Joseph Fielding Smith and Marion G. Romney.
Marion G. Romney (April 1981) “The Restoration of Israel to the Lands of Their Inheritance“: 17.2
Joseph Fielding Smith (April 1971) “Out of the Darkness“: 16.8
And SeanK, sorry I didn’t answer your question about splitting out talks based on what calling a person held at the time. Unfortunately, no, I haven’t done this. So everyone who was a Seventy before being called into the Q of 15 has all his talks lumped together, for example.
LOL, Romney’s talk is almost completely scripture quotes! No wonder it scored so abnormally.
JFS’s talk is long declarative sentences. It seems quite comprehensible, since the sentences are frequently broken up into simpler phrases.
Great analysis Ziff! Thanks for your many great efforts to analyze all sorts of sometimes obscure, but interesting trends in the church.
Thanks, el oso! I’m so glad to hear you enjoy my stats stuff. 🙂
This is really interesting stuff, Ziff! Thanks for doing it!
I want to add a small word of caution about reading too much in the results though. Flesch-Kincaid scores are a great, simple measurement but they shouldn’t be taken as proof positive that one speaker is better than another, or even more intellectual.
For example, President Obama’s speeches score much lower than Gerald Ford on this score. Does that mean his speeches less sophisticated or complex? I certainly don’t think so. You might even say a good speaker is one who can address complicated ideas in simple sentences.
This study is still informative but we should remember to take conclusions suggested by empirical analysis with a dose of salt inversely proportional to the reliability of the data generating process.
P.S. Does anyone know of a study measuring the correlation of the Flesch-Kincaid to human reader assessed complexity? I’m certain it’s positive but I bet it’s below 0.6.
My sources:
http://blog.lib.umn.edu/cspg/smartpolitics/2012/01/my_message_is_simple_obamas_so.php
http://www.economist.com/blogs/johnson/2012/01/readability
Oh, sure, David, that’s an excellent point. F-K scores are definitely far from a perfect indicator of complexity. And of course I wouldn’t make any claim about relationship to quality. But you know my standard operating procedure: get a little bit of data and jump to a bunch of conclusions. 🙂
Wouldn’t you naturally expect the women’s score to trend lower on average due to their intended audiences? Two thirds of the auxiliary presidencies are responsible for distinctly younger demographics.
That’s a good point, Eric.